


[ad_1]
UNITED
STATES
SECURITIES
AND EXCHANGE COMMISSION
Washington,
D.C. 20549
FORM
N-CSR
CERTIFIED
SHAREHOLDER REPORT OF REGISTERED
MANAGEMENT
INVESTMENT COMPANIES
Investment
Company Act file number: 811-23368
1WS
Credit Income Fund
(Exact
name of registrant as specified in charter)
299
Park Avenue, 25th Floor
New
York, New York 10171
(Address
of principal executive offices)
Kurt
A. Locher
Chief
Executive Officer
c/o
1WS Credit Income Fund
299
Park Avenue, 25th Floor
New
York, New York 10171
(Name
and Address of Agent for Service)
Registrants
telephone number, including area code: (212) 377-4810
Date
of fiscal year end: October 31
Date
of reporting period: October 31, 2022 – October 31, 2023
Item
1. Reports to Stockholders.
Table of Contents
| Management Commentary | 1 |
| Consolidated Schedule of Investments | 7 |
| Consolidated Statement of Assets and Liabilities | 19 |
| Consolidated Statement of Operations | 20 |
| Consolidated Statements of Changes in Net Assets | 21 |
| Consolidated Statement of Cash Flows | 22 |
| Consolidated Financial Highlights | 24 |
| Notes to Consolidated Financial Statements | 26 |
| Report of Independent Registered Public Accounting Firm | 38 |
| Approval of Investment Advisory Agreement | 39 |
| Additional Information | 41 |
| Trustees and Officers | 42 |
| Privacy Policy | 44 |
| 1WS Credit Income Fund | Management Commentary |
| October 31, 2023 (Unaudited) |
The 1WS Credit Income Fund (the “Fund”)
was launched in March 2019. As of October 31, 2023, the Fund has gross assets under management of approximately $219 million (approximately
$161 million net assets). The Fund is a non-diversified, closed-end investment management company. Its investment objective is to seek
attractive risk-adjusted total returns through generating income and capital appreciation by investing primarily in a wide array of predominantly
structured credit and securitized debt instruments.
Overview:
The level and direction of interest rates remain at
the center of capital market volatility as investors continue to debate the path of future monetary policy and economic growth. Thus far,
the economy has withstood the Fed’s monetary policy tightening quite well, in our opinion. In fact, we believe the surprising resilience
of YTD economic growth has increased optimism for a so-called soft landing. Consumer spending, which accounts for approximately 70% of
the U.S. economy, has remained strong – in part, we believe, due to continued strength in the labor market, accumulated excess savings
from the pandemic, student loan moratorium, and the majority of consumer debt (mortgage debt) being locked in at low fixed rates rather
than affected by the rapid rise in rates over the past 18 months. However, we believe headwinds are building, and tailwinds abating, for
some consumer sectors. This could increase economic risk and the potential for higher market volatility in the future.
Consumers have been drawing down excess savings accrued
during the pandemic for a couple of years, and this is particularly true for the lowest-income cohorts. In addition, while the majority
of consumer debt (mortgage debt) is locked in at lower fixed rates, lower income groups have a higher share of consumer loans, often with
variable rate such as credit cards. We believe this is one of the reasons that subprime borrowers are experiencing much more stress from
higher interest rates. Continuing high inflation and the recent run-up in energy prices will also increasingly burden the lowest-income
consumers, in our opinion. We have already begun to see an increase in delinquencies across some consumer loan types, in particular auto
loans, personal loans, and credit cards. With the resumption of student loan payments, financial stresses on some consumer borrowers will
likely increase.
While recognizing the continuing elevated economic
and fundamental uncertainty, we believe there are currently many attractive risk-adjusted return opportunities across structured credit
– both outright and, even more so, relative to their corporate credit benchmarks. We believe many structured credit sectors currently
trade at attractive discounts to historical valuations.
Net Return Performance as of 10/31/23*
| Calendar YTD | Fiscal YTD | ITD (3/4/19) | |
| 1WS Credit Income Fund (OWSCX) Class I shares | 9.63% | 11.32% | 34.56% |
| 1WS Credit Income Fund (OWSAX) Class A-2 shares** | 9.06% | 10.64% | 30.39%** |
| Bloomberg Barclays U.S. Aggregate Bond Index1 | -2.77% | 0.36% | -3.44% |
| ICE BofAML U.S. High Yield Index2 | 4.66% | 5.82% | 11.76% |
| * | OWSCX and OWSAX returns are presented net of all fees and expenses, benchmark returns are gross. Please see pp. 5-6 for important disclaimers. |
| ** | OWSAX returns prior to May 2021 reflect the performance of Class I shares, adjusted to reflect the distribution and shareholder servicing fees applicable to Class A-2 shares. Additional information on the relevance of Class I performance prior to May 2021 is available upon request by calling the client service number provided at the bottom of this page. Class A-2 shares are subject to an upfront sales load of up to 3%, which is not reflected in the returns shown above and, if applied, would lower such returns. |
Management Fee: The stated rate of the Management
Fee under the Advisory Agreement is 1.5% applied to the daily gross assets of the Fund. “Gross Assets” means the total assets
of the Fund prior to deducting liabilities. Derivatives will be valued at market value for purposes of determining “Gross Assets”
in the calculation of management fees. Because the Management Fee is based on the Fund’s daily gross assets, the Fund’s use of leverage,
if any, will increase the Management Fee paid to the Adviser. For the initial year of the Fund, the Adviser voluntarily agreed to reduce
the Management Fee to .75%. For the one-year period beginning on March 1, 2020, and continuing through the present, the Adviser has voluntarily
agreed to reduce the Management Fee to 1.25% of the Fund’s daily gross assets. The Adviser’s board is under no obligation
to continue the fee waiver but may continue to do so.
| 1,2 | Please refer to the risk disclosures and definitions on pp. 5-6 for a description of the benchmark indices chosen and the risks associated with comparing 1WS Credit Income Fund returns to those of an index. Investors cannot invest directly in an index. |
Performance data quoted represents past performance,
which is not a guarantee of future results. Current performance may be lower or higher than the performance quoted. The principal
value and investment return of an investment will fluctuate so that your shares, when redeemed, may be worth more or less than their original
cost. You can obtain performance data current to the most recent month end by calling (833) 834-4923 or visiting www.1wscapital.com. Investors
cannot invest directly in an index. All performance shown assumes reinvestment of dividends and capital gains distribution in percent
value. Dividends are not guaranteed and will constitute a return of capital if dividend distributions exceed current-year earnings. Please
refer to the Fund’s most recent Section 19(a) notice for an estimate of the composition of the Fund’s most recent distribution,
available at www.1WSCapital.com.
| Annual Report | October 31, 2023 | 1 |
| 1WS Credit Income Fund | Management Commentary |
| October 31, 2023 (Unaudited) |
Comparison of the Change in Value of a $10,000 Investment
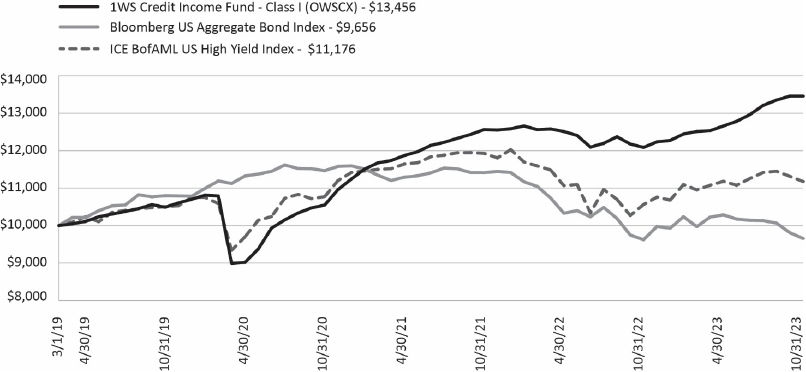
The chart above assumes an initial hypothetical
investment of $10,000 made in Class I shares of the Fund on March 4, 2019 (commencement of operations). Returns shown include the reinvestment
of all dividends. Returns shown do not reflect the deduction of taxes that a shareholder would pay on Fund distributions or share repurchases.
In the absence of fee waivers and reimbursements, which can be necessary to keep expenses at the expense cap, total return would be reduced.
Portfolio Composition1
and Net Return Attribution2
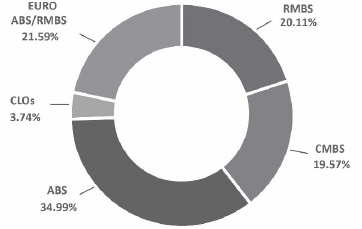
| Asset Type | Net Return2 Attribution Calendar YTD |
| Asset-Backed Securities (ABS) | 1.73% |
| Collateralized Loan Obligations (CLOs) | 0.86% |
| Commercial Mortgage-Backed Securities (CMBS) | 0.26% |
| European ABS & RMBS | 1.51% |
| Residential Mortgage-Backed Securities (RMBS) | 0.60% |
| Other | 1.61% |
| Interest Rate Hedges | 2.49% |
| Total | 9.06% |
| 1 | The Portfolio Composition as of 10/31/23 differs from the portfolio composition for any point prior to such date and is subject to change at any time. Calculation details based on gross data are available by calling the customer service number on page 5. |
| 2 | Net return attribution represents portfolio PnL by sector divided by the Fund’s average net asset value for the period reduced by Class A-2 operating expenses and management fee allocated to the sectors based on the market value of the portfolio for the period. |
| 1WS Credit Income Fund | Management Commentary |
| October 31, 2023 (Unaudited) |
Portfolio Activity:
Continued strength of the U.S economy, despite the
historical rise in the Fed Funds target rate over the past 18 months, has caused many investors to reassess their view on how quickly
they believe the Federal Reserve will cut interest rates in the future. We would characterize much of structured credit markets as continuing
to have significant dispersion within and across sectors and collateral pools, particularly in more credit-sensitive sectors of the capital
structure. This re-enforces the need for comprehensive underwriting in order to identify the most attractive return opportunities and
quantify embedded risks.
Challenges within the commercial real estate (CRE)
market due to increased fundamental uncertainty continue to garner daily headlines. While the greatest challenges are faced by the office
sector due to post pandemic increases in vacancies, all major CRE sectors are struggling with valuation pressures due to higher interest
rates, increasing operating expenses, and increased return requirements among providers of capital. As existing loans mature, many sponsors
are struggling with their ability to refinance without adding significant new equity and generally at much higher borrowing rates. These
general themes continue and have arguably intensified. Higher long-term rates puts greater pressure on cap rates as investors must model
higher return requirements in their terminal valuations.
Despite the macro market headwinds facing CRE, it
is important to remember that it is not a homogeneous market. CRE is property specific, or at least that is how we have generally approached
investments within the sector. Even within the office sector, where challenges are currently greatest, there is significant dispersion
with respect to property-specific performance and fundamentals. It is for this reason that, historically, we have had limited exposure
to pooled conduit CMBS and have favored single-asset single-borrower (SASB) structures, which allows us to be targeted when choosing our
exposures.
Residential Credit fundamentals remain strong, supported
by a continuing strong labor market and sharp increase in home prices over the past several years. Unlike other sectors of consumer credit,
which are seeing increases in delinquencies off of recent lows, mortgage delinquencies continue to decline. Residential mortgage foreclosures
are also near historic lows. The majority of homeowners with existing mortgages are paying fixed rates that are well below current mortgage
rates and are not subject to resetting higher. In addition to being a credit positive for existing homeowners, these low fixed-rate mortgages
are also supporting home prices by reducing the supply of homes available for sale. Borrowers are reluctant to sell their existing home
and move as the cost to finance a new home purchase would be at a significantly higher mortgage rate.
We remain active across the legacy residential mortgage
sector when we are able to identify securities that we believe will realize higher and quicker cash flow recoveries relative to market
assumptions. The majority of seasoned RMBS have experienced meaningful home price appreciation (HPA), which has deleveraged the embedded
credit risk in outstanding securities. However, the bulk of securitizations has been written down due to past losses and forbearance modifications.
In the case of forbearance modifications, these cash flows can be recovered if the underlying mortgage is eventually paid off. A larger
and quicker recovery of cash flows can have a material impact on the realized return of these discount bonds.
We also continue to be active across the credit risk
transfer (CRT) sector following the large dislocation last year. The sector has performed strongly in 2023 as home prices have recovered,
fundamentals have remained strong, and supply has been limited. We have generally favored more seasoned securities with built-up HPA lower
in the capital structure while adding less seasoned exposures higher in the capital structure.
Delinquencies have been increasing across many consumer
loan segments, and we believe that intensifying headwinds could cause accelerating deterioration in some performance metrics. As a result,
we believe that thorough analysis of the underlying collateral (both collateral composition and underwriting integrity), along with discrete
deal structures, are increasingly paramount to uncovering value and identifying potential risks within consumer ABS. While underwriting
is always important, particularly for investors in the fulcrum and lower credit supported tranches, it becomes even more critical in periods
of increasing fundamental uncertainty and a desire to maintain origination volumes among certain consumer lenders, in our opinion. There
is no one-size-fits-all that applies to the analysis and performance forecasting of consumer ABS – or any structured credit asset class,
for that matter.
The good news, in today’s market, is that this
elevated uncertainty has increased dispersion among investors regarding the appropriate modeling assumptions (and therefore pricing) of
securities across sectors, issuers, and vintages. Whether it be credit tiering across loan types/issuers/vintages, or relative performance
across alternative sub-sectors, we believe consensus surrounding expected default probabilities is in short supply. In this type of market,
we believe the best risk-adjusted return opportunities are often found. We continue to be active within and across consumer ABS sectors.
We rely on our underwriting to identify highly attractive risk-adjusted opportunities and do not shy away from distressed opportunities
if we believe the risk is appropriately priced.
We continue to be active in the Non-Dollar ABS sector,
within which we continue to believe valuations are attractive relative to comparable sectors in the U.S. As in the U.S, uncertainty regarding
consumer fundamentals has been increasing and dispersion across originators/issuers/vintages necessitates a sharp focus on underwriting
to differentiate across collateral pools and deal structures.
| Annual Report | October 31, 2023 | 3 |
| 1WS Credit Income Fund | Management Commentary |
| October 31, 2023 (Unaudited) |
While not increasing exposures to the CLO sector this
year, we have been much more actively trading relative value opportunities within the sector and up and down the capital structure. While
outright defaults within the leveraged loan universe continue to remain modest, we believe rising debt burdens as a result of higher interest
rates continues to be a headwind that will present a better entry point for increasing aggregate exposure.
We believe that our use of derivatives is beneficial
in managing portfolio risk exposures and navigating volatile interest rate and credit markets. In particular, we hedge portfolio interest
rate exposure as well as any foreign exchange exposure arising from our non-dollar investments. We can also employ tactical or directional
credit derivatives to help manage credit exposure across our portfolio. Our interest rate hedges have been particularly beneficial over
the past year given monetary policy tightening and the resulting increase in interest rates.
Outlook:
We believe that the market environment, which began
with the Fed’s transition to a more restrictive monetary policy stance, will likely play out in a multi-stage progression. We believe
that the current, or first, phase is characterized by an expectation of slowing growth and increased market and fundamental uncertainty.
Many investors who were encouraged to add risk in search of yield during the low-interest rate, low-volatility, and low-spread environment
that prevailed during much of the past decade will, in our opinion, increasingly find themselves unwilling or unable to properly value
and/or retain these legacy investments as classic “late cycle” factors unfold. As a result, we believe technical outflows
driven by duration losses and increasing fundamental uncertainty have led to large portfolio rebalancing across “real money”
portfolios. This has resulted in periods of stressed sector performance as well as general spread widening and greater credit tiering
within and across credit sectors, in our opinion.
This elevated uncertainty has increased dispersion
among investors regarding the appropriate pricing of securities across sectors, issuers, and vintages. Whether it be consumer credit tiering
across loan types/issuers/vintages, deteriorating property specific fundamentals within CRE, or relative performance across alternative
asset types, we believe consensus surrounding expected default probabilities is in short supply. We believe that this has created attractive
opportunities for us to leverage our infrastructure and underwriting capabilities. With a focus on underwriting asset price volatility
in addition to asset fundamentals and differentiated structural characteristics, we seek to gain insight into identifying the most attractive
risk-adjusted return opportunities across sectors and up and down the capital structure. We have been adding what we believe are attractive
exposures, generally more senior in the capital structure. In our opinion, investor appetite first returns to high-quality, easy-to-underwrite
assets while being more limited for deeper credits with more uncertain fundamental investment profiles. In particular, we have been adding
senior exposure, investment-grade and what we believe are loss-remote, off of stressed/distressed assets at what we consider to be historically
attractive levels. We continue to target opportunities that are shorter in duration where we believe underlying fundamentals or structural
characteristics will drive outperformance relative to current market pricing. We have been adding exposures outright and, increasingly,
relative-to-corporate benchmarks in select sectors where we believe relative valuations will drive convergence over time.
As the cycle evolves, we believe the potential for
continued market dislocations may result in increasing distressed securities and special situations. This could add to the opportunities
we currently see, assuming risk premia adequately reflects the embedded risk profile. Eventually, with greater intermediate-term visibility
into both the macro backdrop as well as evolving credit fundamentals, we will be more likely to extend portfolio spread duration and add
specific asset profiles with greater structural leverage when we believe the risk is appropriately valued.
| 1WS Credit Income Fund | Management Commentary |
| October 31, 2023 (Unaudited) |
Investing in the Fund may be considered speculative
and involves a high degree of risk, including the risk of possible substantial loss of your investment.
Prior to investing, Investors should carefully
consider the investment objectives, risks, charges and expenses of the 1WS Credit Income Fund. This and other important information about
the Fund is contained in the prospectus, which can be obtained by calling (833) 834-4923 or visiting www.1wscapital.com. The prospectus
should be read carefully before investing.
Net performance data are pre-tax, fund-level,
net of operating expenses, management fees, and any applicable shareholder servicing and distribution fees charged to investors. Actual
returns experienced by an investor may vary due to these factors, among others.
1WS Credit Income Fund is distributed by ALPS Distributors,
Inc. ALPS Distributors, Inc. is not affiliated with 1WS Capital Advisors, LLC or One William Street Capital Management, L.P.
Risk Disclosures
Past performance is not a guarantee of future results. There is no
assurance that the Fund will meet its investment objective.
Limited liquidity is provided to shareholders only
through the Fund’s quarterly repurchase offers for no less than 5% of the Fund’s shares outstanding at net asset value. There
is no guarantee that shareholders will be able to sell all of the shares they desire to sell in a quarterly repurchase offer. The Fund
is suitable only for investors who can bear the risks associated with the limited liquidity of the Fund and should be viewed as a long-term
investment.
The Fund’s investments may be negatively
affected by the broad investment environment in the real estate market, the debt market and/or the equity securities market. The value
of the Fund’s investments will increase or decrease based on changes in the prices of the investments it holds. This will cause
the value of the Fund’s shares to increase or decrease. The Fund is “non-diversified” under the Investment Company Act
of 1940 and, thus, changes in the financial condition or market value of a single issuer may cause a greater fluctuation in the Fund’s
net asset value than in a “diversified” fund. Diversification does not eliminate the risk of experiencing investment losses.
The Fund is not intended to be a complete investment program.
The Fund expects most of its investments to be
in securities that are rated below investment grade or would be rated below investment grade if they were rated. Below investment grade
instruments or “junk securities” are particularly susceptible to economic downturns compared to higher rated investments.
While the Fund may employ hedging techniques to seek to minimize interest rate risk, there can be no assurance that it will engage in
such techniques at any given time or that such techniques would be successful. As such, the Fund is subject to interest rate risk and
may decline in value as interest rates rise. The Fund may use leverage to achieve its investment objective, which involves risks, including
the increased likelihood of net asset value volatility and the increased risk that fluctuations in interest rates on borrowings will reduce
the return to investors. In addition to the normal risks associated with investing, investing in international and emerging markets involves
risk of capital loss from unfavorable fluctuations in currency values, differences in generally accepted accounting principles or from
social, economic or political instability in other nations. The Fund may employ hedging techniques to seek to minimize foreign currency
risk.
There can be no assurance that the Fund will engage
in such techniques at any given time or that such techniques would be successful. The Fund may invest in derivatives, which, depending
on market conditions and the type of derivative, are more volatile than other investments and could magnify the Fund’s gains or
losses. An investment in shares should be considered only by investors who can assess and bear the illiquidity and other risks associated
with such an investment.
Market risk may affect a single issuer, sector
of the economy, industry or the market as a whole. Mortgage-backed and asset-backed securities are affected by interest rates, financial
health of issuers/originators, creditworthiness of entities providing credit enhancements and the value of underlying assets. Fixed-income
securities present issuer default risk. Prepayment and extension risk exists because a loan, bond or other investment may be called, prepaid
or redeemed before maturity and similar yielding investments may not be available for purchase. Structured finance securities may present
risks similar to those of the other types of debt obligations in which the Fund may invest and, in fact, such risks may be of greater
significance in the case of structured finance securities. Investing in structured finance securities may be affected by a variety of
factors, including priority in the capital structure of the issuer thereof, the availability of any credit enhancement, and the level
and timing of payments and recoveries on and the characteristics of the underlying receivables, loans or other assets that are being securitized,
among others. Market or other (e.g., interest rate) environments may adversely affect the liquidity of Fund investments, negatively impacting
their price. Generally, the less liquid the market at the time the Fund sells a holding, the greater the risk of loss or decline of value
to the Fund. See the Fund’s prospectus for information on these and other risks.
There can be no assurance that the Fund will achieve
its investment objective. Many of the Fund’s investments may be considered speculative and subject to increased risk. Investing
in the Fund involves risks, including the risk that you may receive little or no return on your investment or that you may lose part or
all of your investment. The ability of the Fund to achieve its investment objective depends, in part, on the ability of the Adviser to
allocate effectively the assets of the Fund among the various securities and investments in which the Fund invests. There can be no assurance
that the actual allocations or investment selections will be effective in achieving the Fund’s investment objective or delivering
positive returns.
| Annual Report | October 31, 2023 | 5 |
| 1WS Credit Income Fund | Management Commentary |
| October 31, 2023 (Unaudited) |
The information provided is not intended to be
a forecast of future events, a guarantee of future results or investment advice, so actual outcomes and results may differ significantly
from the views expressed. These views are subject to change at any time based upon economic, market or other conditions and the portfolio
manager disclaims any responsibility to update such views. The views expressed in this report reflect the current views of the portfolio
manager as of October 31, 2023.
There are limitations when comparing the 1WS Credit
Income Fund to indices. Many open-end funds which track these indices offer daily liquidity, while closed-end interval funds offer liquidity
on a periodic basis. Deteriorating general market conditions will reduce the value of stock securities. When interest rates rise, the
value of bond securities tends to fall. Investing in lower-rated securities involves special risks in addition to the risks associated
with investments in investment grade securities, including a high degree of credit risk. Lower-rated securities may be regarded as predominately
speculative with respect to the issuer’s continuing ability to meet principal and interest payments. Analysis of the creditworthiness
of issuers/issues of lower-rated securities may be more complex than for issuers/issues of higher quality debt securities. There is a
risk that issuers will not make payments, resulting in losses to the Fund. In addition, the credit quality of securities may be lowered
if an issuer’s financial condition changes. Assets and securities contained within indices are different than the assets and securities
contained in the 1WS Credit Income Fund and will therefore have different risk and reward profiles. An investment cannot be made in an
index, which is unmanaged and has returns that do not reflect any trading, management or other costs. Please see definitions for a description
of the investment indexes selected.
Definitions
ABS: Asset-Backed Securities are
instruments secured by financial, physical, and/or intangible assets (e.g., receivables or pools of receivables), and investments in any
assets/instruments underlying the foregoing structured/secured obligations.
Basis Points (bps): A basis point is a common unit of
measurement for interest rates and credit spreads and is equal to one hundredth of one percent.
CLO: Collateralized Loan Obligations
are instruments that represent debt and equity tranches of collateralized loan obligations and collateralized debt obligations.
CMBS: Commercial Mortgage-Backed Securities are fixed
income instruments that are secured by mortgage loans on commercial real property.
Credit Risk Transfer (CRT) Securities:
CRT securities effectively transfer a portion of the risk associated with credit losses within pools of residential mortgage loans to
investors.
Interest Rate Hedges: Interest rate
hedges include a variety of different products to help protect against interest rate risk. In principle, interest rate hedging products
provide greater certainty over future loan repayments.
Non-Dollar ABS: Non-Dollar Asset-Backed
Securities are instruments secured by financial, physical, and/or intangible assets (e.g., receivables or pools of receivables), and investments
in any assets/instruments underlying the foregoing structured/secured obligations outside of the U.S. Non-Dollar Asset-Backed Securities
are denominated in currencies other than the U.S. Dollar.
RMBS: Residential Mortgage-Backed
Securities are securities that may be secured by interests in a single residential mortgage loan or a pool of mortgage loans secured by
residential property.
Risk Premia: Risk Premia is the investment return an asset
is expected to yield in excess of the risk-free rate of return.
SASB: Single Asset Single Borrower
(SASB) CMBS transactions involve the securitization of a single loan (SA) or collateralized by a group of assets all owned by the same
borrower (SB).
Tranche: Tranches are segments created
from a pool of assets – usually debt instruments such as bonds or mortgages – that are divvied up by risk, time to maturity, or other
characteristics in order to be marketable to different investors.
| 1WS Credit Income Fund | Consolidated Schedule of Investments |
| October 31, 2023 |
| Description | Rate | Maturity Date(a) | Principal Amount | Fair Value | ||||||||
| MORTGAGE-BACKED SECURITIES (56.54%) | ||||||||||||
| Residential (34.11%) | ||||||||||||
| ACE Securities Corp. Home Equity Loan Trust, Series 2006-OP2, Class M1(b)(c) | 1M CME TERM SOFR + 0.49% | 08/25/36 | $ | 661,635 | $ | 473,334 | ||||||
| AIMS , Series 2007-1, Class B(b) | 1M BBSW + 0.25% | 07/10/38 | AUD | 958,524 | 479,195 | |||||||
| Alternative Loan Trust, Series 2007-21CB, Class 2A2(b) | 27.94% – 1M CME TERM SOFR | 09/25/37 | $ | 34,402 | 23,139 | |||||||
| Alternative Loan Trust, Series 2007-21CB, Class 2A3(b) | 1M CME TERM SOFR + 0.61% | 09/25/37 | 1,014,592 | 363,122 | ||||||||
| Alternative Loan Trust, Series 2007-21CB, Class 2A4(b)(d) | 5.49% – 1M CME TERM SOFR | 09/25/37 | 937,846 | 59,741 | ||||||||
| Ameriquest Mortgage Securities Trust, Series 2006-R1, Class M4(b) | 1M CME TERM SOFR + 0.95% | 03/25/36 | 707,241 | 664,877 | ||||||||
| APS Resecuritization Trust, Series 2014-1, Class 1M(b)(e) | 1.44% | 08/28/54 | 2,290,614 | 523,176 | ||||||||
| Argent Securities, Inc. Asset-Backed Pass-Through Certificates, Series 2005-W5, Class M1(b)(c) |
1M CME TERM SOFR + 0.80% | 01/25/36 | 526,256 | 445,634 | ||||||||
| Asset Backed Securities Corp. Home Equity Loan Trust Series OOMC, Series 2006-HE3, Class M1(b) |
1M CME TERM SOFR + 0.56% | 03/25/36 | 633,794 | 491,507 | ||||||||
| Atlas Funding PLC, Series 2023-1, Class F(b) | N/A(f) | 01/25/61 | £ | 402,000 | 498,823 | |||||||
| Banc of America Funding , Series 2007-5, Class CA8(b)(d) | 5.35% – 1M US L | 07/25/37 | $ | 2,407,236 | 100,863 | |||||||
| Bear Stearns Mortgage Funding Trust, Series 2006-AR1, Class 1A2(b) | 1M CME TERM SOFR + 0.61% | 07/25/36 | 275,917 | 294,238 | ||||||||
| Bear Stearns Mortgage Funding Trust, Series 2006-AR5, Class 2A2(b) | 1M CME TERM SOFR + 0.57% | 01/25/37 | 776,842 | 711,199 | ||||||||
| Bellemeade Re, Ltd., Series 2021-1A, Class M2(b)(e) | 30D US SOFR + 4.85% | 03/25/31 | 797,000 | 839,400 | ||||||||
| Carrington Mortgage Loan Trust, Series 2007-FRE1, Class M1(b) | 1M CME TERM SOFR + 0.61% | 02/25/37 | 679,325 | 432,526 | ||||||||
| Castell PLC, Series 2023-1, Class G(b) | N/A(f) | 05/25/55 | £ | 399,000 | 486,517 | |||||||
| Connecticut Avenue Securities, Series 2021-R02, Class 2B2(b)(e) | 30D US SOFR + 6.20% | 11/25/41 | $ | 666,000 | 668,531 | |||||||
| Connecticut Avenue Securities Trust, Series 2022-R04, Class 1B1(b)(c)(e) | 30D US SOFR + 5.25% | 03/25/42 | 500,000 | 532,500 | ||||||||
| Connecticut Avenue Securities Trust, Series 2022-R05, Class 2B1(b)(c)(e) | 30D US SOFR + 4.50% | 04/25/42 | 338,000 | 347,937 | ||||||||
| Connecticut Avenue Securities Trust, Series 2023-R02, Class 1B1(b)(c)(e) | 30D US SOFR + 5.55% | 01/25/43 | 500,000 | 528,150 | ||||||||
| Connecticut Avenue Securities Trust, Series 2023-R03, Class 2B1(b)(c)(e) | 30D US SOFR + 6.35% | 04/25/43 | 643,000 | 697,655 | ||||||||
| Connecticut Avenue Securities Trust, Series 2023-R06, Class 1B1(b)(c)(e) | 30D US SOFR + 3.90% | 07/25/43 | 1,201,000 | 1,219,976 | ||||||||
| Countrywide Alternative Loan Trust, Series 2005-64CB, Class 1A17 | 5.50% | 12/25/35 | 148,994 | 94,343 | ||||||||
| CWABS Asset-Backed Certificates Trust, Series 2004-15, Class MV7(b) | 1M CME TERM SOFR + 2.51% | 02/25/35 | 734,113 | 479,669 | ||||||||
| CWABS Asset-Backed Certificates Trust, Series 2005-2, Class M6(b)(c) | 30D US SOFR + 2.03% | 08/25/35 | 531,221 | 475,921 | ||||||||
| CWABS Asset-Backed Certificates Trust 2006-11, Series 2006-12, Class M1(b) | 1M CME TERM SOFR + 0.56% | 12/25/36 | 671,631 | 442,202 | ||||||||
| Deutsche Alt-A Securities Mortgage Loan Trust, Series 2007-OA4, Class 2A2(b) | 1M CME TERM SOFR + 0.75% | 08/25/47 | 883,996 | 583,084 | ||||||||
| Dilosk Rmbs NO 7 DAC, Series 2023-7, Class X1(b) | 3M EUR L + 6.33% | 10/20/62 | € | 446,000 | 473,045 | |||||||
| Domi BV, Series 2020-1, Class F(b) | 3M EUR L + 6.50% | 04/15/52 | 500,000 | 517,887 | ||||||||
| Domi BV, Series 2020-1, Class X2(b) | 3M EUR L + 6.75% | 04/15/52 | 500,000 | 525,982 | ||||||||
| Domi BV, Series 2021-1, Class E(b) | 3M EUR L + 6.50% | 06/15/53 | 704,000 | 692,536 | ||||||||
| Domi BV, Series 2021-1, Class X2(b) | 3M EUR L + 6.50% | 06/15/53 | 411,000 | 428,617 | ||||||||
| Eagle RE, Ltd., Series 2021-1, Class M2(b)(e) | 30D US SOFR + 4.45% | 10/25/33 | $ | 1,140,000 | 1,185,828 | |||||||
| Eurosail-UK 2007-5np PLC, Series 2007-5X, Class B1C(b) | SONIA IR + 2.14% | 09/13/45 | £ | 405,377 | 449,751 | |||||||
| See Notes to Consolidated Financial Statements. | |
| Annual Report | October 31, 2023 | 7 |
| 1WS Credit Income Fund | Consolidated Schedule of Investments |
| October 31, 2023 |
| Description | Rate | Maturity Date(a) | Principal Amount | Fair Value | ||||||||
| MORTGAGE-BACKED SECURITIES (continued) | ||||||||||||
| Fieldstone Mortgage Investment Trust, Series 2005-3, Class M2(b) | 1M CME TERM SOFR + 0.79% | 02/25/36 | $ | 1,626,000 | $ | 448,613 | ||||||
| Finance Ireland Rmbs, Series 3, Class F(b) | 3M EUR L + 4.23% | 06/24/61 | € | 420,000 | 438,447 | |||||||
| Finsbury Square 2021-2 PLC, Series 2021-2X, Class G(b) | 3M SONIA IR + 5.25% | 12/16/71 | £ | 371,000 | 422,163 | |||||||
| First Franklin Mortgage Loan Trust, Series 2005-FF12, Class M3(b)(c) | 1M CME TERM SOFR + 0.86% | 11/25/36 | $ | 1,963,667 | 1,149,530 | |||||||
| First Franklin Mortgage Loan Trust, Series 2006-FFH1, Class M2(b) | 1M CME TERM SOFR + 0.71% | 01/25/36 | 541,590 | 464,197 | ||||||||
| Freddie Mac Stacr Remic Trust, Series 2020-DNA1, Class B2(b)(e) | 30D US SOFR + 5.36% | 01/25/50 | 494,000 | 503,880 | ||||||||
| Freddie Mac STACR REMIC Trust, Series 2020-HQA3, Class B2(b)(e) | 30D US SOFR + 10.11% | 07/25/50 | 1,029,000 | 1,285,221 | ||||||||
| Freddie Mac STACR REMIC Trust, Series 2020-HQA4, Class B2(b)(e) | 30D US SOFR + 9.51% | 09/25/50 | 439,000 | 540,804 | ||||||||
| Freddie Mac STACR REMIC Trust, Series 2022-DNA3, Class B1(b)(c)(e) | 30D US SOFR + 5.65% | 04/25/42 | 563,000 | 598,188 | ||||||||
| Freddie Mac STACR Trust, Series 2019-DNA3, Class B2(b)(e) | 30D US SOFR + 8.26% | 07/25/49 | 469,000 | 527,203 | ||||||||
| Freddie Mac Structured Agency Credit Risk Debt Notes, Series 2023-DNA2, Class B1(b)(c)(e) | 30D US SOFR + 7.60% | 04/25/43 | 955,000 | 1,031,686 | ||||||||
| Freddie Mac Structured Agency Credit Risk Debt Notes, Series 2023-DNA2, Class M2(b)(c)(e) | 30D US SOFR + 5.70% | 04/25/43 | 830,000 | 899,637 | ||||||||
| Fremont Home Loan Trust, Series 2004-C, Class M3(b) | 1M US L + 1.73% | 08/25/34 | 170 | – | ||||||||
| FT Rmbs Miravet, Series 2023-1, Class E(b) | 3M EUR L + 3.00% | 11/26/66 | € | 600,000 | 535,822 | |||||||
| FT Rmbs Miravet, Series 2023-1, Class F(b) | 3M EUR L + 4.00% | 11/26/66 | 600,000 | 517,094 | ||||||||
| GSAA Home Equity Trust, Series 2007-8, Class A4(b) | 1M CME TERM SOFR + 1.31% | 08/25/37 | $ | 547,743 | 279,897 | |||||||
| Home Equity Mortgage Loan Asset-Backed Trust Series INABS, Series 2005-D, Class M2(b) | 1M CME TERM SOFR + 0.82% | 03/25/36 | 458,743 | 283,916 | ||||||||
| Home Equity Mortgage Loan Asset-Backed Trust Series INABS, Series 2006-A, Class M1(b) | 1M CME TERM SOFR + 0.71% | 03/25/36 | 788,430 | 472,822 | ||||||||
| Home Equity Mortgage Loan Asset-Backed Trust Series INABS, Series 2006-C, Class M1(b) | 1M CME TERM SOFR + 0.55% | 08/25/36 | 543,641 | 528,854 | ||||||||
| Home RE, Ltd., Series 2021-1, Class B1(b)(e) | 30D US SOFR + 3.76% | 07/25/33 | 956,000 | 952,750 | ||||||||
| Home RE, Ltd., Series 2022-1, Class M1C(b)(c)(e) | 30D US SOFR + 5.50% | 10/25/34 | 1,064,000 | 1,111,986 | ||||||||
| Home RE, Ltd., Series 2023-1, Class M1B(b)(c)(e) | 30D US SOFR + 4.60% | 10/25/33 | 1,000,000 | 1,002,300 | ||||||||
| JP Morgan Mortgage Acquisition Corp., Series 2005-OPT2, Class M7(b) | 1M US L + 2.48% | 12/25/35 | 232,109 | 174,778 | ||||||||
| JP Morgan Mortgage Acquisition Corp., Series 2006-FRE2, Class M3(b) | 1M US L + 0.56% | 02/25/36 | 891,434 | 523,272 | ||||||||
| JP Morgan Mortgage Acquisition Trust, Series 2006-HE2, Class M2(b)(c) | 1M CME TERM SOFR + 0.59% | 07/25/36 | 1,093,238 | 991,349 | ||||||||
| Lansdowne Mortgage Securities No 1 PLC, Series 2006-1, Class M2(b) | 3M EUR L + 0.84% | 06/15/45 | € | 500,000 | 358,167 | |||||||
| Lehman Mortgage Trust, Series 2006-9, Class 1A5(b)(c) | 1M CME TERM SOFR + 0.71% | 01/25/37 | $ | 698,500 | 400,171 | |||||||
| Lehman Mortgage Trust, Series 2007-5, Class 6A1(b) | 1M CME TERM SOFR + 0.43% | 10/25/36 | 691,408 | 325,584 | ||||||||
| Miravet Sarl – Compartment, Series 2019-1, Class E(b) | 3M EUR L + 3.00% | 05/26/65 | € | 500,000 | 494,556 | |||||||
| Miravet Sarl – Compartment, Series 2020-1, Class E(b) | 3M EUR L + 4.00% | 05/26/65 | 1,000,000 | 1,011,121 | ||||||||
| Nationstar Home Equity Loan Trust, Series 2007-B, Class M2(b)(c) | 1M CME TERM SOFR + 0.58% | 04/25/37 | $ | 1,161,917 | 1,046,422 | |||||||
| Newgate Funding PLC, Series 2007-1X, Class DB(b) | 3M EUR L + 0.75% | 12/01/50 | € | 554,841 | 472,128 | |||||||
| Oaktown Re VII, Ltd., Series 2021-2, Class M1B(b)(c)(e) | 30D US SOFR + 2.90% | 04/25/34 | $ | 562,000 | 562,955 | |||||||
| Ownit Mortgage Loan Trust, Series 2005-4, Class M1(b)(c) | 1M US L + 0.83% | 08/25/36 | 998,236 | 840,615 | ||||||||
| Parkmore Point RMBS 2022-1 PLC, Series 2022-1X, Class D(b) | SONIA IR + 3.50% | 07/25/45 | £ | 440,000 | 515,546 | |||||||
| See Notes to Consolidated Financial Statements. | |
| 8 | www.1wscapital.com |
| 1WS Credit Income Fund | Consolidated Schedule of Investments |
| October 31, 2023 |
| Maturity | Principal | Fair | ||||||||||
| Description | Rate | Date(a) | Amount | Value | ||||||||
| MORTGAGE-BACKED SECURITIES (continued) | ||||||||||||
| Pierpont Btl PLC, Series 2023-1, Class X(b) | SONIA IR + 7.94% | 09/21/54 | £ | 345,009 | $ | 422,445 | ||||||
| Polaris PLC, Series 2022-1, Class X2(b) | 3M SONIA IR + 5.89% | 10/23/59 | 74,927 | 91,507 | ||||||||
| Polaris PLC, Series 2022-2, Class E(b) | SONIA IR + 5.75% | 05/23/59 | 795,579 | 943,007 | ||||||||
| Polaris PLC, Series 2023-1, Class F(b) | SONIA IR + 8.25% | 02/23/61 | 403,000 | 491,394 | ||||||||
| Polaris PLC, Series 2023-2, Class F(b) | SONIA IR + 8.75% | 09/23/59 | 403,000 | 491,051 | ||||||||
| Popular ABS Mortgage Pass-Through Trust, Series 2005-5, Class MF1(g) | 3.44% | 11/25/35 | $ | 400,103 | 265,108 | |||||||
| Popular ABS Mortgage Pass-Through Trust, Series 2005-D, Class M1(c)(g) | 3.51% | 01/25/36 | 393,878 | 311,636 | ||||||||
| Portman Square 2023-NPL1 DAC, Series 2023-NPL1X, Class B(b) | 3M EUR L + 4.00% | 07/25/63 | € | 482,000 | 473,794 | |||||||
| Residential Accredit Loans, Inc., Series 2006-Q05, Class 1A2(b)(c) | 1M US L + 0.19% | 05/25/46 | $ | 876,014 | 903,083 | |||||||
| Residential Accredit Loans, Inc., Series 2006-QS9, Class 1A16(b)(c) | 1M CME TERM SOFR + 0.76% | 07/25/36 | 420,150 | 307,928 | ||||||||
| Residential Accredit Loans, Inc., Series 2006-QS9, Class 1A5(b)(c) | 1M CME TERM SOFR + 0.81% | 07/25/36 | 619,415 | 454,403 | ||||||||
| Residential Asset Securitization Trust, Series 2005-A15, Class 2A10(b) | 1M CME TERM SOFR + 0.56% | 02/25/36 | 1,379,225 | 482,591 | ||||||||
| Residential Mortgage Securities 32 PLC, Series 2020-32X, Class F1(b) | 3M SONIA IR + 6.50% | 06/20/70 | £ | 500,000 | 613,134 | |||||||
| SMI Equity Release 2018-1 DAC, Series 2023-1, Class BRR(b) | 3M EUR L + 5.00% | 12/20/67 | € | 500,000 | 484,292 | |||||||
| Soundview Home Loan Trust, Series 2005-OPT4, Class M2(b) | 1M US L + 0.83% | 12/25/35 | $ | 1,754,346 | 1,370,846 | |||||||
| Soundview Home Loan Trust, Series 2006-OPT2, Class M1(b) | 1M CME TERM SOFR + 0.56% | 05/25/36 | 628,605 | 452,219 | ||||||||
| Stratton Mortgage Funding, Series 2021-2X, Class X(b) | 3M SONIA IR + 4.00% | 07/20/60 | £ | 219,014 | 266,760 | |||||||
| Structured Asset Investment Loan Trust, Series 2005-8, Class M2(b) | 1M CME TERM SOFR + 0.86% | 10/25/35 | $ | 1,000,735 | 741,945 | |||||||
| Structured Asset Investment Loan Trust, Series 2005-9, Class M2(b)(c) | 1M US L + 0.68% | 11/25/35 | 1,294,391 | 1,004,188 | ||||||||
| Structured Asset Investment Loan Trust, Series 2006-BNC3, Class A4(b)(c) | 1M CME TERM SOFR + 0.42% | 09/25/36 | 1,907,568 | 983,924 | ||||||||
| SYON, Series 2020-2, Class E | 6.27% | 12/17/27 | £ | 950,589 | 1,175,152 | |||||||
| Together Asset Backed Securitisation 2023-1st1 PLC, Series 2023-1ST1X, Class X(b) | SONIA IR + 6.46% | 01/20/67 | 208,189 | 253,626 | ||||||||
| Twin Bridges PLC, Series 2021-1, Class X2(b) | 3M SONIA IR + 5.00% | 03/12/55 | 149,364 | 181,817 | ||||||||
| Twin Bridges PLC, Series 2021-2, Class X2(b) | SONIA IR + 4.40% | 09/12/55 | 334,591 | 403,832 | ||||||||
| Twin Bridges PLC, Series 2022-1, Class X2(b) | 3M SONIA IR + 5.00% | 12/01/55 | 377,000 | 445,486 | ||||||||
| Twin Bridges PLC, Series 2022-2, Class E(b) | SONIA IR + 5.50% | 06/12/55 | 241,000 | 292,250 | ||||||||
| Uropa Securities PLC, Series 2007-1, Class B1A(b) | SONIA IR + 1.47% | 10/10/40 | 552,555 | 577,780 | ||||||||
| Uropa Securities PLC, Series 2007-1, Class B1B(b) | 3M EUR L + 1.35% | 10/10/40 | € | 535,791 | 489,082 | |||||||
| Uropa Securities PLC, Series 2007-1, Class B2A(b) | SONIA IR + 4.12% | 10/10/40 | £ | 451,328 | 485,208 | |||||||
| WaMu Mortgage Pass-Through Certificates, Series 2006-AR3, Class A1C(b) | 12M US FED + 1.00% | 02/25/46 | $ | 315,097 | 347,174 | |||||||
| Total Residential Mortgage Backed Securities | $ | 55,149,241 | ||||||||||
| Commercial (22.43%) | ||||||||||||
| Atrium Hotel Portfolio Trust, Series 2018-ATRM, Class E(b)(c)(e) | 1M CME TERM SOFR + 3.70% | 06/15/35 | $ | 1,000,000 | $ | 965,400 | ||||||
| BAMLL Commercial Mortgage Securities Trust, Series 2021-JACX, Class C(b)(e) | 1M CME TERM SOFR + 2.11% | 09/15/38 | 587,000 | 507,344 | ||||||||
| BAMLL Commercial Mortgage Securities Trust, Series 2021-JACX, Class D(b)(e) | 1M CME TERM SOFR + 2.86% | 09/15/38 | 515,000 | 424,000 | ||||||||
| BAMLL Commercial Mortgage Securities Trust, Series 2021-JACX, Class F(b)(c)(e) | 1M CME TERM SOFR + 5.11% | 09/15/38 | 2,500,000 | 2,008,250 | ||||||||
| See Notes to Consolidated Financial Statements. | |
| Annual Report | October 31, 2023 | 9 |
| 1WS Credit Income Fund | Consolidated Schedule of Investments |
| October 31, 2023 |
| Description | Rate | Maturity Date(a) | Principal Amount | Fair Value | ||||||||
| MORTGAGE-BACKED SECURITIES (continued) | ||||||||||||
| BBCMS Mortgage Trust, Series 2021-AGW, Class A(b)(e) | 1M CME TERM SOFR + 1.36% | 06/15/36 | $ | 560,000 | $ | 504,168 | ||||||
| BBCMS Mortgage Trust, Series 2021-AGW, Class F(b)(c)(e) | 1M CME TERM SOFR + 4.11% | 06/15/36 | 2,000,000 | 1,651,600 | ||||||||
| BFLD, Series 2019-DPLO, Class E(b)(c)(e) | 1M US SOFR + 2.35% | 10/15/34 | 2,000,000 | 1,986,000 | ||||||||
| BFLD Trust, Series 2021-FPM, Class D(b)(c)(e) | 1M CME TERM SOFR + 4.76% | 06/15/38 | 500,000 | 482,050 | ||||||||
| BFLD Trust, Series 2021-FPM, Class E(b)(c)(e) | 1M CME TERM SOFR + 5.76% | 06/15/38 | 533,000 | 506,030 | ||||||||
| BHMS, Series 2018-ATLS, Class D(b)(e) | 1M CME TERM SOFR + 2.55% | 07/15/35 | 2,168,000 | 2,059,817 | ||||||||
| BPR Trust, Series 2021-WILL, Class C(b)(c)(e) | 1M CME TERM SOFR + 4.11% | 06/15/38 | 500,000 | 480,750 | ||||||||
| BPR Trust, Series 2021-WILL, Class E(b)(c)(e) | 1M CME TERM SOFR + 6.86% | 06/15/38 | 500,000 | 476,100 | ||||||||
| Citigroup Commercial Mortgage Trust, Series 2013-GC17, Class D(b)(c)(e) | 5.10% | 11/10/46 | 2,000,000 | 1,819,400 | ||||||||
| Citigroup Commercial Mortgage Trust, Series 2014-GC25, Class E(e) | 3.30% | 10/10/47 | 564,000 | 343,363 | ||||||||
| Citigroup Commercial Mortgage Trust, Series 2016-C1, Class E(b)(e) | 4.94% | 05/10/49 | 1,364,000 | 1,081,107 | ||||||||
| COMM 2014-CCRE18 Mortgage Trust, Series 2014-CR18, Class E(c)(e) | 3.60% | 07/15/47 | 1,000,000 | 829,400 | ||||||||
| COMM Mortgage Trust, Series 2019-521F, Class A(b)(e) | 1M CME TERM SOFR + 1.05% | 06/15/34 | 650,000 | 585,390 | ||||||||
| CSMC, Series 2020-FACT, Class D(b)(c)(e) | 1M CME TERM SOFR + 3.82% | 10/15/37 | 500,000 | 469,750 | ||||||||
| CSMC, Series 2020-FACT, Class E(b)(c)(e) | 1M CME TERM SOFR + 4.98% | 10/15/37 | 534,000 | 493,042 | ||||||||
| GS Mortgage Securities Corp. Trust, Series 2020-DUNE, Class G(b)(e) | 1M CME TERM SOFR + 4.11% | 12/15/36 | 839,000 | 770,286 | ||||||||
| GS Mortgage Securities Corp. Trust, Series 2021-ROSS, Class C(b)(c)(e) | 1M CME TERM SOFR + 2.11% | 05/15/26 | 567,000 | 478,718 | ||||||||
| GS Mortgage Securities Trust, Series 2013-GC10, Class D(b)(e) | 4.54% | 02/10/46 | 585,000 | 512,928 | ||||||||
| HPLY Trust, Series 2019-HIT, Class F(b)(c)(e) | 1M CME TERM SOFR + 3.26% | 11/15/26 | 880,535 | 862,220 | ||||||||
| J.P. Morgan Chase Commercial Mortgage Securities Trust, Series 2017-FL11, Class E(b)(e) | PRIME + 0.96% | 10/15/32 | 134,545 | 136,549 | ||||||||
| JP Morgan Chase Commercial Mortgage Securities Trust, Series 2019-BKWD, Class D(b)(e) | 1M CME TERM SOFR + 2.46% | 09/15/29 | 500,000 | 346,400 | ||||||||
| JPMBB Commercial Mortgage Securities Trust, Series 2013-C15, Class E(e) | 3.50% | 11/15/45 | 1,000,000 | 849,300 | ||||||||
| JPMBB Commercial Mortgage Securities Trust, Series 2013-C15, Class F(e) | 3.59% | 11/15/45 | 1,098,000 | 870,604 | ||||||||
| Morgan Stanley Bank of America Merrill Lynch Trust, Series 2014-C14, Class E(b)(c)(e) | 5.05% | 02/15/47 | 682,000 | 626,076 | ||||||||
| Morgan Stanley Bank of America Merrill Lynch Trust, Series 2014-C14, Class F(c)(e) | 3.71% | 02/15/47 | 500,000 | 448,500 | ||||||||
| Morgan Stanley Bank of America Merrill Lynch Trust, Series 2015-C25, Class E(b)(c)(e) | 4.52% | 10/15/48 | 660,000 | 518,826 | ||||||||
| Morgan Stanley Bank of America Merrill Lynch Trust, Series 2015-C25, Class G(b)(c)(e) | 4.52% | 10/15/48 | 1,447,289 | 697,883 | ||||||||
| See Notes to Consolidated Financial Statements. | ||
| 10 | www.1wscapital.com | |
| 1WS Credit Income Fund | Consolidated Schedule of Investments |
| October 31, 2023 |
| Description | Rate | Maturity Date(a) | Principal Amount | Fair Value | ||||||||
| MORTGAGE-BACKED SECURITIES (continued) | ||||||||||||
| Morgan Stanley Capital I Trust, Series 2017-ASHF, Class E(b)(e) | 1M CME TERM SOFR + 3.32% | 11/15/34 | $ | 580,000 | $ | 556,394 | ||||||
| Morgan Stanley Capital I Trust, Series 2018-H3, Class D(c)(e) | 3.00% | 07/15/51 | 1,000,000 | 650,000 | ||||||||
| Natixis Commercial Mortgage Securities Trust, Series 2019-FAME, Class C(b)(c)(e) | 4.25% | 08/15/36 | 895,000 | 691,030 | ||||||||
| Natixis Commercial Mortgage Securities Trust, Series 2019-FAME, Class D(b)(c)(e) | 4.40% | 08/15/36 | 378,000 | 268,342 | ||||||||
| SMR Mortgage Trust, Series 2022-IND, Class E(b)(c)(e) | 1M CME TERM SOFR + 5.00% | 02/15/39 | 927,725 | 850,538 | ||||||||
| SMR Mortgage Trust, Series 2022-IND, Class F(b)(c)(e) | 1M CME TERM SOFR + 6.00% | 02/15/39 | 467,573 | 408,799 | ||||||||
| Taubman Centers Commercial Mortgage Trust, Series 2022-DPM, Class C(b)(e) | 1M CME TERM SOFR + 3.78% | 05/15/37 | 500,000 | 486,650 | ||||||||
| VCP Tyler Pref, LLC(h) | 13.50% | 12/29/25 | 2,070,067 | 2,070,067 | ||||||||
| Wells Fargo Commercial Mortgage Trust, Series 2015-NXS3, Class E(c)(e) | 3.15% | 09/15/57 | 1,311,000 | 1,054,962 | ||||||||
| Wells Fargo Commercial Mortgage Trust, Series 2015-NXS3, Class F(c)(e) | 3.15% | 09/15/57 | 489,500 | 372,705 | ||||||||
| Wells Fargo Commercial Mortgage Trust, Series 2015-NXS3, Class G(c)(e) | 3.15% | 09/15/57 | 814,500 | 594,992 | ||||||||
| Wells Fargo Commercial Mortgage Trust, Series 2022-ONL, Class E(b)(c)(e) | 4.93% | 12/15/39 | 536,000 | 424,619 | ||||||||
| Wells Fargo Commercial Mortgage Trust, Series 2022-ONL, Class F(b)(c)(e) | 4.93% | 12/15/39 | 559,000 | 433,561 | ||||||||
| WFRBS Commercial Mortgage Trust, Series 2013-C11, Class E(b)(e) | 4.05% | 03/15/45 | 542,000 | 352,571 | ||||||||
| WFRBS Commercial Mortgage Trust, Series 2013-C17, Class E(c)(e) | 3.50% | 12/15/46 | 249,000 | 247,805 | ||||||||
| Wilmot Plaza Mezz Loan, Class F(h) | 11.15% | 10/01/31 | 2,000,000 | 2,000,000 | ||||||||
| Total Commercial Mortgage Backed Securities | $ | 36,254,286 | ||||||||||
| TOTAL MORTGAGE-BACKED SECURITIES (Cost $94,986,353) | $ | 91,403,527 | ||||||||||
| ASSET-BACKED SECURITIES (53.39%) | ||||||||||||
| ACC Trust, Series 2022-1, Class C(e) | 3.24% | 10/20/25 | $ | 1,100,000 | $ | 814,770 | ||||||
| ACHV ABS TRUST, Series 2023-4CP, Class E(e) | 10.50% | 11/25/30 | 1,000,000 | 973,700 | ||||||||
| ACM Auto Trust 2023-1, Series 2023-1A, Class D(c)(e) | 12.58% | 01/22/30 | 1,808,000 | 1,824,814 | ||||||||
| ACM Auto Trust 2023-2, Series 2023-2A, Class B(c)(e) | 9.85% | 06/20/30 | 1,835,000 | 1,840,688 | ||||||||
| Affirm Asset Securitization Trust, Series 2023-B, Class D(e) | 8.78% | 09/15/28 | 500,000 | 501,250 | ||||||||
| Ares Lusitani-STC SA / Pelican Finance 2, Series 2021-2, Class E(b) | 6.40% | 01/25/35 | € | 206,185 | 198,573 | |||||||
| Aurorus 2023 BV, Series 2023-1, Class F(b) | 11.19% | 08/13/49 | 500,000 | 530,373 | ||||||||
| Aurorus 2023 BV, Series 2023-1, Class G(b) | 12.94% | 08/13/49 | 515,000 | 530,045 | ||||||||
| Auto Abs Spanish Loans Fondo Titulizacion, Series 2022-1, Class D(b) | 1M EUR L + 4.25% | 02/28/32 | 730,652 | 758,028 | ||||||||
| Autonoria Spain 2021 FT, Series 2021-SP, Class G(b) | 5.25% | 01/31/39 | 413,364 | 393,074 | ||||||||
| Autonoria Spain 2022 FT, Series 2022-SP, Class E(b) | 1M EUR L + 7.00% | 01/29/40 | 424,856 | 457,722 | ||||||||
| Autonoria Spain 2023 FT, Series 2023-SP, Class F(b) | 1M EUR L + 6.90% | 09/30/41 | 500,000 | 530,373 | ||||||||
| Azure Finance NO 2 PLC, Series 2020-2, Class F(b) | SONIA IR + 7.00% | 07/20/30 | £ | 633,000 | 769,226 | |||||||
| BL Consumer Credit 2021, Series 2021-1, Class E(b) | 1M EUR L + 2.85% | 09/25/38 | € | 482,000 | 501,283 | |||||||
| BL Consumer Credit 2021, Series 2021-1, Class G | 5.80% | 09/25/38 | 561,000 | 573,709 | ||||||||
| Brignole Co. 2021 SRL, Series 2021-2021, Class F(b) | 1M EUR L + 5.90% | 07/24/36 | 424,000 | 436,880 | ||||||||
| CarNow Auto Receivables Trust 2023-1, Series 2023-1A, Class E(e) | 12.04% | 04/16/29 | $ | 423,000 | 424,988 | |||||||
| CFG Investments, Ltd., Series 2023-1, Class A(e) | 8.56% | 07/25/34 | 1,555,000 | 1,556,555 | ||||||||
| Conn’s Receivables Funding LLC, Series 2022-A, Class B(c)(e) | 9.52% | 12/15/26 | 435,202 | 437,552 | ||||||||
| Conn’s Receivables Funding LLC, Series 2022-A, Class C(e) | N/A(f) | 12/15/26 | 665,000 | 574,493 | ||||||||
| See Notes to Consolidated Financial Statements. | |
| Annual Report | October 31, 2023 | 11 |
| 1WS Credit Income Fund | Consolidated Schedule of Investments |
| October 31, 2023 |
| Description | Rate | Maturity Date(a) | Principal Amount | Fair Value | ||||||||
| ASSET-BACKED SECURITIES (continued) | ||||||||||||
| Conn’s Receivables Funding LLC, Series 2023-A, Class B(e) | 10.00% | 01/17/28 | $ | 371,000 | $ | 371,000 | ||||||
| CPS Auto Receivables Trust, Series 2022-C, Class E(e) | 9.08% | 04/15/30 | 700,000 | 695,590 | ||||||||
| CPS Auto Receivables Trust, Series 2022-D, Class E(c)(e) | 12.12% | 06/17/30 | 1,156,000 | 1,231,718 | ||||||||
| CPS Auto Receivables Trust, Series 2023-A, Class E(e) | 10.59% | 08/15/30 | 1,400,000 | 1,412,460 | ||||||||
| Credito Real USA Auto Receivables Trust 2021-1, Series 2021-1A, Class C(e) | 4.37% | 01/18/28 | 1,108,000 | 1,041,631 | ||||||||
| Dowson PLC, Series 2021-2, Class F(b) | SONIA IR + 5.30% | 10/20/28 | £ | 661,000 | 771,919 | |||||||
| Dowson PLC, Series 2021-2, Class X(b) | SONIA IR + 6.25% | 10/20/28 | 177,733 | 212,288 | ||||||||
| Dowson PLC, Series 2022-1, Class E(b) | SONIA IR + 4.80% | 01/20/29 | 490,000 | 588,365 | ||||||||
| Dowson PLC, Series 2022-2, Class E(b) | SONIA IR + 8.00% | 08/20/29 | 651,000 | 799,250 | ||||||||
| E-Carat 11 PLC, Series 2020-11, Class G(b) | 1M SONIA IR + 5.00% | 05/18/28 | 46,001 | 55,023 | ||||||||
| Exeter Automobile Receivables Trust 2022-3, Series 2022-3A, Class E(e) | 9.09% | 01/15/30 | $ | 1,396,000 | 1,310,704 | |||||||
| Exeter Automobile Receivables Trust 2022-4, Series 2022-4A, Class E(e) | 8.23% | 03/15/30 | 2,853,000 | 2,719,765 | ||||||||
| Exeter Automobile Receivables Trust 2022-5, Series 2022-5A, Class E(e) | 10.45% | 04/15/30 | 1,989,000 | 2,008,890 | ||||||||
| Exeter Automobile Receivables Trust 2022-6, Series 2022-6A, Class E(e) | 11.61% | 06/17/30 | 1,342,000 | 1,404,806 | ||||||||
| Exeter Automobile Receivables Trust 2023-1, Series 2023-1A, Class E(c)(e) | 12.07% | 09/16/30 | 892,000 | 949,445 | ||||||||
| Exeter Automobile Receivables Trust 2023-2, Series 2023-2A, Class E(e) | 9.75% | 11/15/30 | 840,000 | 824,544 | ||||||||
| FCT Autonoria DE 2023, Series 2023-DE, Class F(b) | 1M EUR L + 7.50% | 01/26/43 | € | 485,249 | 520,578 | |||||||
| FCT Autonoria DE 2023, Series 2023-DE, Class G(b) | 1M EUR L + 10.50% | 01/26/43 | 483,713 | 509,821 | ||||||||
| FCT Noria 2021, Series 2021-1, Class F(b) | 1M EUR L + 3.70% | 10/25/49 | 441,885 | 451,709 | ||||||||
| FCT Noria 2021, Series 2021-1, Class G | 5.95% | 10/25/49 | 773,299 | 749,824 | ||||||||
| FCT Pixel 2021, Series 2021-1, Class G | 5.50% | 02/25/38 | 262,050 | 255,038 | ||||||||
| Flagship Credit Auto Trust, Series 2021-1, Class R(e)(h) | N/A(f) | 04/17/28 | $ | 2,740 | 307,368 | |||||||
| Flagship Credit Auto Trust, Series 2022-2, Class E(c)(e) | 8.20% | 06/15/29 | 926,000 | 875,996 | ||||||||
| Flagship Credit Auto Trust, Series 2022-4, Class E(c)(e) | 12.66% | 01/15/30 | 1,879,000 | 1,977,459 | ||||||||
| Flagship Credit Auto Trust, Series 2023-3, Class E(e) | 9.74% | 06/17/30 | 1,000,000 | 976,700 | ||||||||
| Fortuna Consumer Loan ABS 2021 DAC, Series 2021-2021, Class E(b) | 1M EUR L + 3.50% | 10/18/30 | € | 300,000 | 318,605 | |||||||
| FTA Santander Consumer Spain Auto, Series 2022-1, Class E(b) | 3M EUR L + 12.00% | 09/20/38 | 500,000 | 531,695 | ||||||||
| FTA Santander Consumer Spain Auto, Series 2023-1, Class E(b) | 3M EUR L + 7.25% | 09/22/39 | 500,000 | 530,320 | ||||||||
| FTA Santander Consumer Spain Auto, Series 2023-1, Class F(b) | 3M EUR L + 10.00% | 09/22/39 | 500,000 | 530,320 | ||||||||
| FTA Santander Consumo 4, Series 2021-4, Class E | 4.90% | 09/18/32 | 323,535 | 324,874 | ||||||||
| GAMMA Sociedade de Titularizacao de Creditos SA Consumer Totta 1, Series 2022-1, Class D(b) | 3M EUR L + 8.00% | 06/25/33 | 500,000 | 538,573 | ||||||||
| GLS Auto Receivables Issuer Trust 2019-2, Series 2019-2A, Class R(e)(h) | N/A(f) | 02/17/26 | $ | 1,091 | 123,200 | |||||||
| GLS Auto Receivables Issuer Trust 2019-3, Series 2019-3A, Class R(e)(h) | N/A(f) | 05/15/26 | 882 | 117,570 | ||||||||
| GLS Auto Receivables Issuer Trust 2019-4, Series 2019-4A, Class R(e)(h) | N/A(f) | 08/17/26 | 941 | 112,849 | ||||||||
| Golden Bar Securitisation Srl, Series 2019-1, Class C | 8.25% | 07/20/39 | € | 469,359 | 475,175 | |||||||
| Golden Bar Securitisation Srl, Series 2021-1, Class E | 2.75% | 09/22/41 | 392,075 | 384,321 | ||||||||
| Golden Bar Securitisation Srl, Series 2023-2, Class E(b) | 3M EUR L + 8.50% | 09/22/43 | 470,000 | 498,451 | ||||||||
| Golden Bar Securitisation Srl, Series 2023-2, Class F(b) | 3M EUR L + 10.90% | 09/22/43 | 470,000 | 498,401 | ||||||||
| Hertz Vehicle Financing LLC, Series 2021-1A, Class D(e) | 3.98% | 12/26/25 | $ | 5,000,000 | 4,751,000 | |||||||
| KeyCorp Student Loan Trust, Series 2006-A, Class 2C(b)(c) | 3M CME TERM SOFR + 1.41% | 03/27/42 | 2,000,000 | 1,611,400 | ||||||||
| Lendingpoint Asset Securitization Trust, Series 2022-B, Class C(e) | 8.45% | 10/15/29 | 517,000 | 429,989 | ||||||||
| Lobel Automobile Receivables Trust, Series 2023-1, Class D(e) | 8.00% | 03/15/30 | 500,000 | 434,850 | ||||||||
| Marlette Funding Trust 2021-2, Series 2021-2A, Class R(e)(h) | N/A(f) | 09/15/31 | 1,686 | 86,548 | ||||||||
| Mercury Financial Credit Card Master Trust, Series 2023-1A, Class B(c)(e) | 9.59% | 09/20/27 | 500,000 | 500,250 | ||||||||
| Metro Finance, Series 2023-1, Class E(b) | 1M BBSW + 7.00% | 02/18/29 | AUD | 740,000 | 470,404 | |||||||
| See Notes to Consolidated Financial Statements. | |
| 12 | www.1wscapital.com |
| 1WS Credit Income Fund | Consolidated Schedule of Investments |
| October 31, 2023 |
| Description | Rate | Maturity Date(a) | Principal Amount | Fair Value | ||||||||
| ASSET-BACKED SECURITIES (continued) | ||||||||||||
| Metro Finance, Series 2023-1, Class F(b) | 1M BBSW + 8.75% | 02/18/29 | AUD | 480,000 | $ | 305,127 | ||||||
| National Collegiate Student Loan Trust, Series 2005-3, Class B(b) | 1M US L + 0.50% | 07/27/37 | $ | 2,547,000 | 1,921,202 | |||||||
| Navient Private Education Refi Loan Trust 2021-B, Series 2021-BA, Class R(e)(h) | N/A(f) | 07/15/69 | 3,695 | 1,661,158 | ||||||||
| Newday Funding Master Issuer PLC – Series 2021-1, Series 2021-1X, Class E(b) | SONIA IR + 4.05% | 03/15/29 | £ | 452,000 | 543,286 | |||||||
| Newday Funding Master Issuer PLC – Series 2021-2, Series 2021-2X, Class E(b) | SONIA IR + 3.55% | 07/15/29 | 419,000 | 502,450 | ||||||||
| NOW Trust, Series 2021-1, Class F(b) | 1M BBSW + 6.40% | 06/14/29 | AUD | 283,147 | 179,417 | |||||||
| Pagaya AI Debt Selection Trust, Series 2020-3, Class CERT(b)(d)(e)(h) | N/A(f) | 05/17/27 | $ | 510,470 | 54,248 | |||||||
| Pagaya AI Debt Selection Trust, Series 2021-1, Class C(e) | 4.09% | 11/15/27 | 630,740 | 558,836 | ||||||||
| Pagaya AI Debt Trust, Series 2023-1, Class B(c)(e) | 9.44% | 07/15/30 | 677,906 | 686,515 | ||||||||
| Pagaya AI Debt Trust, Series 2023-3, Class B(e) | 9.57% | 12/16/30 | 499,900 | 508,449 | ||||||||
| Pagaya AI Debt Trust, Series 2023-5, Class C(c)(e) | 9.10% | 04/15/31 | 265,000 | 267,093 | ||||||||
| Pagaya AI Debt Trust, Series 2023-6, Class D(e) | 9.00% | 06/16/31 | 2,750,000 | 2,539,625 | ||||||||
| Pavillion Point of Sale 2021-1, Ltd., Series 2022-1, Class F(b) | SONIA IR + 4.30% | 12/30/31 | £ | 394,000 | 471,321 | |||||||
| PBD Germany Auto Lease Master SA – Compartment 2021-1, Series 2021-GE2, Class E(b) | 1M EUR L + 3.50% | 11/26/30 | € | 451,192 | 472,870 | |||||||
| PBD Germany Auto Lease Master SA – Compartment 2021-1, Series 2021-GE2, Class F(b) | 1M EUR L + 4.50% | 11/26/30 | 225,596 | 232,974 | ||||||||
| PBD Germany Auto Lease Master SA – Compartment 2021-1, Series 2021-GE2, Class G | 6.50% | 11/26/30 | 106,667 | 111,036 | ||||||||
| Prestige Auto Receivables Trust 2023-1, Series 2023-1A, Class E(e) | 9.88% | 05/15/30 | $ | 1,086,000 | 1,071,556 | |||||||
| Prosper Marketplace Issuance Trust Series 2023-1, Series 2023-1A, Class D(e) | 11.24% | 07/16/29 | 500,000 | 498,600 | ||||||||
| Prosper Marketplace Issuance Trust Series 2023-1, Series 2023-1A, Class E(e) | 15.49% | 07/16/29 | 1,000,000 | 927,800 | ||||||||
| Reach ABS Trust 2023-1, Series 2023-1A, Class D(c)(e) | 12.27% | 02/18/31 | 2,000,000 | 2,037,200 | ||||||||
| Reach Financial LLC – Asset-Based Private Credit(h)(i) | 9.00% | 12/31/49 | 980,221 | 980,221 | ||||||||
| Red & Black Auto Italy Srl, Series 2023-2, Class E(b) | 1M EUR L + 7.00% | 07/28/34 | € | 469,000 | 497,490 | |||||||
| Research-Driven Pagaya Motor Asset Trust 2023-3, Series 2023-3A, Class C(e) | 9.00% | 01/26/32 | $ | 551,000 | 497,994 | |||||||
| Research-Driven Pagaya Motor Asset Trust VII, Series 2022-3A, Class C(e) | 10.04% | 11/25/30 | 999,675 | 992,178 | ||||||||
| Satus PLC, Series 2021-1, Class F(b) | 1M SONIA IR + 5.40% | 08/17/28 | £ | 600,000 | 700,391 | |||||||
| SC Germany SA Compartment Consumer, Series 2020-1, Class F(b) | 1M EUR L + 5.30% | 11/14/34 | € | 368,689 | 389,447 | |||||||
| SCF Rahoituspalvelut X DAC, Series 2021-10, Class D | 5.35% | 10/25/31 | 345,108 | 332,185 | ||||||||
| SoFi Professional Loan Program, Series 2020-A, Class R1(e)(h) | N/A(f) | 05/15/46 | $ | 14,661 | 317,161 | |||||||
| SoFi Professional Loan Program, Series 2018-D, Class R1(e)(h) | N/A(f) | 02/25/48 | 27,236 | 184,205 | ||||||||
| SoFi Professional Loan Program, Series 2020-B, Class R1(e)(h) | N/A(f) | 05/15/46 | 15,664 | 519,854 | ||||||||
| SoFi Professional Loan Program, Series 2021-A, Class R1(e)(h) | N/A(f) | 08/17/43 | 35,142 | 471,790 | ||||||||
| SoFi Professional Loan Program, Series 2021-B, Class R1(e)(h) | N/A(f) | 02/15/47 | 14,625 | 567,673 | ||||||||
| SoFi Professional Loan Program LLC, Series 2017-D, Class R1(e)(h) | N/A(f) | 09/25/40 | 16,181 | 165,134 | ||||||||
| SoFi Professional Loan Program LLC, Series 2019-A, Class R1(e)(h) | N/A(f) | 06/15/48 | 32,016 | 230,068 | ||||||||
| SoFi Professional Loan Program Trust, Series 2020-A, Class R1(e)(h) | N/A(f) | 05/15/46 | 10,720 | 231,905 | ||||||||
| Southern Auto Finance Company LLC, Mezz WH 2021 – Asset-Based Private Credit(h)(i) | 9.00% | 06/30/25 | 1,103,279 | 1,103,279 | ||||||||
| TAGUS – Sociedade de Titularizacao de Creditos SA/Silk Finance No 5, Series 2020-5, Class D | 7.25% | 02/25/35 | € | 317,285 | 315,173 | |||||||
| See Notes to Consolidated Financial Statements. | |
| Annual Report | October 31, 2023 | 13 |
| 1WS Credit Income Fund | Consolidated Schedule of Investments |
| October 31, 2023 |
| Description | Rate | Maturity Date(a) | Principal Amount | Fair Value | ||||||||
| ASSET-BACKED SECURITIES (continued) | ||||||||||||
| TAGUS – Sociedade de Titularizacao de Creditos SA/Ulisses Finance No. 2, Series 2021-2, Class F(b) | 1M EUR L + 5.49% | 09/20/38 | € | 290,087 | $ | 288,126 | ||||||
| Theorem Funding Trust 2022-3, Series 2022-3A, Class B(e) | 8.95% | 04/15/29 | $ | 247,000 | 251,767 | |||||||
| United Auto Credit Securitization Trust, Series 2022-1, Class E(c)(e) | 5.00% | 11/10/28 | 1,987,000 | 1,779,160 | ||||||||
| United Auto Credit Securitization Trust, Series 2022-2, Class E(e) | 10.00% | 04/10/29 | 475,000 | 437,760 | ||||||||
| United Auto Credit Securitization Trust, Series 2023-1, Class E(e) | 10.98% | 09/10/29 | 529,000 | 533,972 | ||||||||
| Upstart Pass-Through Trust, Series 2020-ST2, Class CERT(e)(h) | N/A(f) | 03/20/28 | 5,000,000 | 427,211 | ||||||||
| Upstart Pass-Through Trust, Series 2020-ST4, Class CERT(e)(h) | N/A(f) | 11/20/26 | 1,150,718 | 153,304 | ||||||||
| Upstart Pass-Through Trust, Series 2021-ST10, Class CERT(e)(h) | N/A(f) | 01/20/30 | 300,000 | 104,388 | ||||||||
| Upstart Pass-Through Trust, Series 2022-ST1, Class CERT(e)(h) | N/A(f) | 03/20/30 | 557,333 | 143,787 | ||||||||
| Upstart Pass-Through Trust, Series 2022-ST2, Class CERT(e)(h) | N/A(f) | 04/20/30 | 500,000 | 114,204 | ||||||||
| Upstart Securitization Trust, Series 2021-4, Class CERT(e)(h) | N/A(f) | 09/20/31 | 6,175 | 465,021 | ||||||||
| Upstart Securitization Trust, Series 2022-1, Class C(e) | 5.71% | 03/20/32 | 500,000 | 329,300 | ||||||||
| Upstart Securitization Trust, Series 2023-1, Class C(e) | 11.10% | 02/20/33 | 1,251,000 | 1,243,869 | ||||||||
| Upstart Securitization Trust, Series 2023-2, Class C(e) | 11.87% | 06/20/33 | 1,119,000 | 1,129,519 | ||||||||
| Upstart Structured Pass-Through Trust, Series 2022-1A, Class CERT(e)(h) | N/A(f) | 04/15/30 | 608 | 397,062 | ||||||||
| Upstart Structured Pass-Through Trust, Series 2022-4A, Class B(e) | 8.54% | 11/15/30 | 502,000 | 505,163 | ||||||||
| USASF Receivables LLC, Series 2021-1A, Class D(e) | 4.36% | 03/15/27 | 1,125,000 | 688,500 | ||||||||
| Vasco Finance, Series 2023-1, Class E(b) | 1M EUR L + 8.50% | 10/27/40 | € | 200,000 | 212,128 | |||||||
| Vasco Finance, Series 2023-1, Class F | 15.00% | 10/27/40 | 200,000 | 213,165 | ||||||||
| Veros Auto Receivables Trust, Series 2023-1, Class C(e) | 8.32% | 11/15/28 | $ | 305,000 | 302,316 | |||||||
| Veros Auto Receivables Trust, Series 2023-1, Class D(e) | 11.46% | 08/15/30 | 1,000,000 | 996,800 | ||||||||
| Zip Master Trust, Series 2021-1, Class D(b) | 1M BBSW + 3.70% | 04/10/33 | AUD | 500,000 | 313,432 | |||||||
| Zip Master Trust, Series 2021-1, Class E(b) | 1M BBSW + 5.70% | 04/10/33 | 500,000 | 314,510 | ||||||||
| TOTAL ASSET-BACKED SECURITIES (Cost $93,304,803) | $ | 86,310,157 | ||||||||||
| COLLATERALIZED LOAN OBLIGATIONS (4.28%)(b) | ||||||||||||
| Barings CLO, Ltd. 2018-III, Series 2018-3A, Class E(b)(e) | 3M CME TERM SOFR + 6.01% | 07/20/29 | $ | 539,000 | $ | 495,718 | ||||||
| Generate CLO 2, Ltd., Series 2017-3A, Class ER(b)(c)(e) | 3M CME TERM SOFR + 6.66% | 10/20/29 | 250,000 | 248,850 | ||||||||
| Golub Capital Partners Short Duration 2022-1, Series 2022-1A, Class C(b)(e) | 3M CME TERM SOFR + 4.60% | 10/25/31 | 1,092,000 | 1,092,655 | ||||||||
| KKR CLO 23, Ltd., Series 2018-23, Class F(b)(e) | 3M CME TERM SOFR + 8.11% | 10/20/31 | 398,000 | 332,887 | ||||||||
| OZLM XI, Ltd., Series 2017-11A, Class DR(b)(e) | 3M CME TERM SOFR + 7.26% | 10/30/30 | 162,000 | 144,942 | ||||||||
| OZLM XI, Ltd., Series 2017-11X, Class DR(b) | 3M CME TERM SOFR + 7.26% | 10/30/30 | 552,000 | 493,874 | ||||||||
| OZLM XXII, Ltd., Series 2018-22A, Class D(b)(e) | 3M CME TERM SOFR + 5.56% | 01/17/31 | 955,000 | 761,708 | ||||||||
| RR 2, Ltd., Series 2017-2A, Class SUB(e)(h) | N/A(f) | 10/15/17 | 1,426,000 | 905,510 | ||||||||
| Symphony CLO XVII, Ltd., Series 2018-17A, Class ER(b)(c)(e) | 3M CME TERM SOFR + 5.81% | 04/15/28 | 1,305,560 | 1,303,732 | ||||||||
| Taberna Preferred Funding II, Ltd., Series 2005-2A, Class B(b)(e) | 3M CME TERM SOFR + 1.16% | 11/05/35 | 529,000 | 100,510 | ||||||||
| TICP CLO IX, Ltd., Series 2018-9A, Class E(b)(c)(e) | 3M CME TERM SOFR + 5.86% | 01/20/31 | 563,768 | 541,217 | ||||||||
| See Notes to Consolidated Financial Statements. | |
| 14 | www.1wscapital.com |
| 1WS Credit Income Fund | Consolidated Schedule of Investments |
| October 31, 2023 |
| Description | Rate | Maturity Date(a) | Principal Amount | Fair Value | ||||||||
| COLLATERALIZED LOAN OBLIGATIONS (continued) | ||||||||||||
| TICP CLO X, Ltd., Series 2018-10X, Class E(b) | 3M CME TERM SOFR + 5.76% | 04/20/31 | $ | 526,000 | $ | 502,278 | ||||||
| TOTAL COLLATERALIZED LOAN OBLIGATIONS (Cost $7,153,985) | $ | 6,923,881 | ||||||||||
| Shares | Fair Value | |||||||
| PREFERRED STOCKS (0.33%)(b)(j) | ||||||||
| New York Mortgage Trust, Inc., Series D | 8,071 | $ | 154,963 | |||||
| New York Mortgage Trust, Inc., Series E | 17,808 | 377,886 | ||||||
| TOTAL PREFERRED STOCKS (Cost $486,581) | $ | 532,849 | ||||||
| 7-Day Yield | Shares | Fair Value | ||||||||||
| MONEY MARKET FUNDS (17.10%) | ||||||||||||
| BlackRock Liquidity Funds T-Fund | 5.24 | % | 26,094,173 | $ | 26,094,173 | |||||||
| BlackRock Liquidity Funds Treasury Trust Fund Portfolio | 5.27 | % | 1,416,275 | 1,416,275 | ||||||||
| BNY Mellon U.S. Treasury Fund, Institutional Class | 5.20 | % | 142,547 | 142,547 | ||||||||
| TOTAL MONEY MARKET FUNDS (Cost $27,652,995) | $ | 27,652,995 | ||||||||||
| Fair Value | ||||
| TOTAL INVESTMENTS (131.64%) (Cost $223,584,717) | $ | 212,823,409 | ||
| Liabilities in Excess of Other Assets (-31.64%)(k) | (51,157,488 | ) | ||
| NET ASSETS (100.00%) | $ | 161,665,921 | ||
Percentages above are stated as a percentage of net assets as of October
31, 2023
Investment Abbreviations:
LIBOR – London Interbank Offered Rate
EURIBOR – Euro Interbank Offered Rate
SONIA IR – Sterling Over Night Index Average
BBSW – Bank Bill Swap Rate
SOFR – Secured Overnight Financing Rate
Reference Rates:
1M EUR L – 1 Month EURIBOR as of October 31, 2023 was 3.88%
3M EUR L – 3 Month EURIBOR as of October 31, 2023 was 3.97%
6M EUR L – 6 Month EURIBOR as of October 31, 2023 was 4.09%
1M US L – 1 Month USD LIBOR as of October 31, 2023 was 5.43%
3M US L – 3 Month USD LIBOR as of October 31, 2023 was 5.64%
1M SONIA IR – 1 Month SONIA as of October 31, 2023 was 5.19%
3M SONIA IR – 3 Month SONIA as of October 31, 2023 was 5.21%
See Notes to Consolidated Financial Statements.
| Annual Report | October 31, 2023 | 15 |
| 1WS Credit Income Fund | Consolidated Schedule of Investments |
| October 31, 2023 |
1M BBSW – 1 Month BBSW as of October 31, 2023 was 4.12%
30D US SOFR – 30 Day US SOFR as of October 31, 2023 was 5.32%
12M US FED – 12 Month US FED as of October 31, 2023 was 5.01%
| (a) | The maturity date for credit investments represents the expected maturity. Many of the instruments are callable through cash flows on the underlying securities or other call features. Expected maturity may be earlier than legal maturity. |
| (b) | Floating or variable rate security. The Reference Rate is described above. Interest rate shown reflects the rate in effect at October 31, 2023. For securities based on a published reference rate and spread, the reference rate and spread are indicated in the description above. Certain variable rate securities are not based on a published reference rate and spread but are determined by the issuer or agent and are based on current market conditions. These securities do not indicate a reference rate and spread in their description above. |
| (c) | On October 31, 2023, all or a portion of these securities were pledged as collateral for reverse repurchase agreements in the amount of 89,985,854. |
| (d) | Interest only security. |
| (e) | Securities not registered under the Securities Act of 1933, as amended (the “Securities Act”). These securities generally involve certain transfer restrictions and may be sold in the ordinary course of business in transactions exempt from registration. As of October 31, 2023, the aggregate market value of those securities was $112,277,000, representing 69.45% of net assets. |
| (f) | This security is a residual or equity position that does not have a stated interest rate. This residual or equity position is entitled to recurring distributions which are generally equal to the remaining cash flow of payments made by underlying securities less contractual payments to debt holders and fund expenses. |
| (g) | Step bond. Coupon changes periodically based upon a predetermined schedule. Interest rate disclosed is that which is in effect at October 31, 2023. |
| (h) | This security has been classified as level 3 in accordance with ASC 820 as a result of unavailable quoted prices from an active market or the unavailability of other significant observable inputs. |
| (i) | Securities have associated unfunded commitments of $783,779 and $103,891 to Reach Financial LLC and Southern Auto Finance Company LLC, respectively. |
| (k) | Includes cash being held as collateral for derivatives and reverse repurchase agreements. |
DERIVATIVE INSTRUMENTS
CREDIT DEFAULT SWAP CONTRACTS – SELL PROTECTION (OVER THE COUNTER)(a)
| Reference Obligations | Counterparty | Fixed Deal Receive Rate | Currency | Maturity Date | Implied Credit Spread at October 31, 2023(b) | Notional Amount(c) | Value | Upfront Premiums Received/(Paid) | Unrealized Appreciation/ (Depreciation) | |||||||||||||||||
| Markit CMBX BB Series 15 Index | Morgan Stanley | 5.00% | USD | 11/18/64 | 22.20% | 2,000,000 | $ | (793,375 | ) | $ | 820,000 | $ | 26,625 | |||||||||||||
| $ | (793,375 | ) | $ | 820,000 | $ | 26,625 | ||||||||||||||||||||
| See Notes to Consolidated Financial Statements. | |
| 16 | www.1wscapital.com |
| 1WS Credit Income Fund | Consolidated Schedule of Investments |
| October 31, 2023 |
CREDIT DEFAULT SWAP CONTRACTS ON CREDIT INDICES ISSUE – SELL PROTECTION
(CENTRALLY CLEARED)
| Reference Obligations | Counterparty | Fixed Deal Receive Rate | Currency | Maturity Date | Implied Credit Spread at October 31, 2023(b) | Notional Amount(c) | Value | Upfront Premiums Received/(Paid) |
Unrealized Appreciation/ (Depreciation) |
|||||||||||||||||
| Markit CDX NA HY Series 41 Index | ICE | 5.00% | USD | 12/20/28 | 5.16% | 7,744,000 | $ | (51,885 | ) | $ | (43,725 | ) | $ | (95,610 | ) | |||||||||||
| $ | (51,885 | ) | $ | (43,725 | ) | $ | (95,610 | ) | ||||||||||||||||||
Credit default swaps pay quarterly.
| (a) | If the Fund is a seller of protection and a credit event occurs, as defined under the terms of that particular swap agreement, the Fund will either (i) pay to the buyer of protection an amount equal to the notional amount of the swap and take delivery of the referenced obligation or underlying securities comprising the referenced index or (ii) pay a net settlement amount in the form of cash or securities equal to the notional amount of the swap less the recovery value of the referenced obligation or underlying securities comprising the referenced index. |
| (b) | Implied credit spreads, represented in absolute terms, utilized in determining the market value of credit default swap agreements as of year end serve as an indicator of the current status of the payment/performance risk and represent the likelihood or risk of default for the credit derivative. The implied credit spread of a particular referenced entity reflects the cost of buying/selling protection and may include upfront payments required to be made to enter into the agreement. Wider credit spreads represent a deterioration of the referenced entity’s credit soundness and a greater likelihood or risk of default or other credit event occurring as defined under the terms of the agreement. |
| (c) | The maximum potential amount the Fund could be required to pay as a seller of credit protection or receive as a buyer of credit protection if a credit event occurs as defined under the terms of that particular swap agreement. |
INTEREST RATE SWAP CONTRACTS (CENTRALLY CLEARED)
| Pay/Receive Floating Rate | Clearing House | Floating Rate | Expiration Date | Notional Amount | Currency | Fixed Rate | Unrealized Appreciation/ (Depreciation) | |||||||||
| Receive | LCH Ltd. | SOFR | 02/23/2027 | 300,000 | USD | 1.65% | $ | 27,525 | ||||||||
| Receive | LCH Ltd. | SOFR | 02/19/2030 | 2,390,000 | USD | 3.59% | 124,993 | |||||||||
| Receive | LCH Ltd. | SOFR | 02/16/2028 | 26,520,000 | USD | 3.79% | 822,449 | |||||||||
| Receive | LCH Ltd. | 6M EUR L | 02/27/2025 | 3,500,000 | EUR | 3.54% | 13,995 | |||||||||
| Receive | LCH Ltd. | SOFR | 06/21/2028 | 7,786,000 | USD | 3.21% | 443,372 | |||||||||
| $ | 1,432,334 | |||||||||||||||
See Notes to Consolidated Financial Statements.
| Annual Report | October 31, 2023 | 17 |
| 1WS Credit Income Fund | Consolidated Schedule of Investments |
| October 31, 2023 |
FUTURES CONTRACTS – LONG (CENTRALLY CLEARED)
| Description | Counterparty | Position | Contracts | Expiration Date | Notional Amount | Unrealized Appreciation/ (Depreciation) | ||||||||||
| 2-YR U.S. TREASURY NOTE | Wells Fargo Securities, LLC | Long | 1 | December 2023 | $ | 202,422 | $ | (1,029 | ) | |||||||
| $ | 202,422 | $ | (1,029 | ) | ||||||||||||
FUTURES CONTRACTS – SHORT (CENTRALLY CLEARED)
| Description | Counterparty | Position | Contracts | Expiration Date | Notional Amount | Unrealized Appreciation/ (Depreciation) | ||||||||||
| 10-YR U.S. TREASURY NOTE | Wells Fargo Securities, LLC | Short | 11 | December 2023 | $ | (1,167,891 | ) | $ | 36,759 | |||||||
| 5-YR U.S. TREASURY NOTE | Wells Fargo Securities, LLC | Short | 153 | December 2023 | (15,984,914 | ) | 226,868 | |||||||||
| AUD/USD CURRENCY | Wells Fargo Securities, LLC | Short | 36 | December 2023 | (2,286,720 | ) | 40,737 | |||||||||
| EUR/USD CURRENCY | Wells Fargo Securities, LLC | Short | 142 | December 2023 | (18,819,438 | ) | 120,605 | |||||||||
| EURO BOBL | Wells Fargo Securities, LLC | Short | 3 | December 2023 | (369,139 | ) | 1,568 | |||||||||
| GBP/USD CURRENCY | Wells Fargo Securities, LLC | Short | 173 | December 2023 | (13,141,512 | ) | 276,231 | |||||||||
| $ | (51,769,614 | ) | $ | 702,768 | ||||||||||||
RISK DISCLOSURES
Holdings contained herein are subject to change.
Prior to investing, Investors should carefully
consider the investment objectives, risks, charges and expenses of 1WS Credit Income Fund. This and other important information about
the Fund is contained in the prospectus, which can be obtained by calling (833) 834-4923 or visiting www.1wscapital.com. The prospectus
should be read carefully before investing. Investing in the Fund may be considered speculative and involves a high degree of risk, including
the risk of possible substantial loss of your investment.
1WS Credit Income Fund is distributed by ALPS
Distributors, Inc. ALPS Distributors, Inc. is not affiliated with 1WS Capital Advisors, LLC or One William Street Capital Management,
L.P.
| See Notes to Consolidated Financial Statements. | |
| 18 | www.1wscapital.com |
| 1WS Credit Income Fund | Consolidated Statement of Assets and Liabilities |
| October 31, 2023 |
| ASSETS: | ||||
| Investments, at fair value (Cost $223,584,717) | $ | 212,823,409 | ||
| Cash | 58,920 | |||
| Foreign Currency, at fair value (Cost $2,714,077) | 2,689,635 | |||
| Unrealized appreciation on credit default swap contracts | 26,625 | |||
| Receivable on derivative contracts | 305,350 | |||
| Variation margin receivable on centrally cleared swap contracts | 70,030 | |||
| Variation margin receivable for futures contracts | 102,339 | |||
| Receivable for investment securities sold | 270,557 | |||
| Interest receivable | 1,014,122 | |||
| Capital shares sold receivable | 962,799 | |||
| Deposits held with brokers for derivatives and reverse repurchase agreements | 1,923,636 | |||
| Prepaid expenses and other assets | 48,858 | |||
| Total Assets | 220,296,280 | |||
| LIABILITIES: | ||||
| Payable for swap contracts premiums | 776,275 | |||
| Payable for investment securities purchased | 241,363 | |||
| Payable for reverse repurchase agreements, including accrued interest of $229,366 | 57,005,151 | |||
| Payable for shareholder servicing and distribution fees for Class A-2 | 10,406 | |||
| Net payable to Adviser for investment advisory fees | 176,404 | |||
| Accrued fund accounting, administration and compliance fees payable | 133,297 | |||
| Other payables and accrued expenses | 287,463 | |||
| Total Liabilities | 58,630,359 | |||
| Net Assets Attributable to Shareholders | $ | 161,665,921 | ||
| COMPOSITION OF NET ASSETS ATTRIBUTABLE TO SHARES: | ||||
| Paid-in capital | $ | 167,280,032 | ||
| Total distributable earnings | (5,614,111 | ) | ||
| Net Assets Attributable to Shareholders | $ | 161,665,921 | ||
| NET ASSET VALUE | ||||
| Class I: | ||||
| Net assets | $ | 143,547,016 | ||
| Shares outstanding (unlimited shares authorized, par value $0.001 per share) | 7,633,842 | |||
| Net Asset Value per Share | $ | 18.80 | ||
| Class A-2: | ||||
| Net assets | $ | 18,118,905 | ||
| Shares outstanding (unlimited shares authorized, par value $0.001 per share) | 980,262 | |||
| Net Asset Value per Share | $ | 18.48 | ||
See Notes to Consolidated Financial Statements.
| Annual Report | October 31, 2023 | 19 |
| 1WS Credit Income Fund | Consolidated Statement of Operations |
| For the Year Ended October 31, 2023 | ||||
| INVESTMENT INCOME: | ||||
| Dividends on short term money market funds | $ | 275,572 | ||
| Interest | 15,703,468 | |||
| Total Investment Income | 15,979,040 | |||
| EXPENSES: | ||||
| Investment advisory fee | 2,768,282 | |||
| Fund Accounting and Administration fees | 632,128 | |||
| Compliance fees | 35,000 | |||
| Legal fees | 181,831 | |||
| Audit fees | 195,180 | |||
| Trustees’ fees and expenses | 82,000 | |||
| Transfer agent fees | 285,039 | |||
| Interest on reverse repurchase agreements | 3,053,170 | |||
| Distribution and shareholder servicing fees | 57,351 | |||
| Other expenses | 246,744 | |||
| Total Expenses | 7,536,725 | |||
| Less expenses reimbursed by Adviser (See Note 4) | (712,874 | ) | ||
| Less advisory fees waived (See Note 4) | (461,380 | ) | ||
| Net Expenses | 6,362,471 | |||
| Net Investment Income | 9,616,569 | |||
| REALIZED AND UNREALIZED GAIN/(LOSS) ON INVESTMENTS: | ||||
| Net realized gain/(loss) on: | ||||
| Investment securities | (2,569,178 | ) | ||
| Credit default swap contracts | 1,770,273 | |||
| Interest rate swap contracts | 309,564 | |||
| Futures contracts | 1,030,093 | |||
| Foreign currency transactions | (809,858 | ) | ||
| Net realized loss | (269,106 | ) | ||
| Change in unrealized appreciation/(depreciation) on: | ||||
| Investment securities | 4,398,564 | |||
| Credit default swap contracts | 47,716 | |||
| Interest rate swap contracts | 1,403,765 | |||
| Futures contracts | (1,315,184 | ) | ||
| Foreign currency transactions | 31,591 | |||
| Net change in unrealized appreciation/(depreciation) | 4,566,452 | |||
| Net Realized and Unrealized Gain on Investments | 4,297,346 | |||
| Net Increase in Net Assets Attributable to Shares from Operations | $ | 13,913,915 | ||
| See Notes to Consolidated Financial Statements. | |
| 20 | www.1wscapital.com |
| 1WS Credit Income Fund | Consolidated Statements of Changes in Net Assets |
| For the Year Ended October 31, 2023 | For the Year Ended October 31, 2022 | |||||||
| FROM OPERATIONS: | ||||||||
| Net investment income | $ | 9,616,569 | $ | 8,398,094 | ||||
| Net realized gain/(loss) | (269,106 | ) | 6,811,619 | |||||
| Net change in unrealized appreciation/(depreciation) | 4,566,452 | (19,653,938 | ) | |||||
| Net Increase/(Decrease) in Net Assets Attributable to Shares from Operations | 13,913,915 | (4,444,225 | ) | |||||
| DISTRIBUTIONS TO SHAREHOLDERS: | ||||||||
| Class I | ||||||||
| From distributable earnings | (13,128,665 | ) | (11,259,113 | ) | ||||
| Class A-2 | ||||||||
| From distributable earnings | (609,817 | ) | (30,080 | ) | ||||
| Net Decrease in Net Assets from Distributions to Shareholders | (13,738,482 | ) | (11,289,193 | ) | ||||
| CAPITAL SHARE TRANSACTIONS: | ||||||||
| Class I | ||||||||
| Proceeds from sale of shares | 44,918,206 | 30,079,471 | ||||||
| Cost of shares redeemed | (15,151,352 | ) | (16,626,324 | ) | ||||
| Net asset value of shares issued to shareholders from reinvestment of dividends | 3,104,092 | 2,329,863 | ||||||
| Net Increase from Capital Share Transactions | 32,870,946 | 15,783,010 | ||||||
| Class A-2 | ||||||||
| Proceeds from sale of shares | 16,697,188 | 820,857 | ||||||
| Cost of shares redeemed | (263,548 | ) | – | |||||
| Net asset value of shares issued to shareholders from reinvestment of dividends | 609,817 | 30,081 | ||||||
| Net Increase from Capital Share Transactions | 17,043,457 | 850,938 | ||||||
| Net Increase in Net Assets | 50,089,836 | 900,530 | ||||||
| NET ASSETS: | ||||||||
| Beginning of year | 111,576,085 | 110,675,555 | ||||||
| End of year | $ | 161,665,921 | $ | 111,576,085 | ||||
| OTHER INFORMATION: | ||||||||
| Capital Share Transactions: | ||||||||
| Class I | ||||||||
| Beginning shares | 5,867,411 | 5,114,015 | ||||||
| Shares sold | 2,420,625 | 1,473,760 | ||||||
| Shares redeemed | (824,896 | ) | (836,963 | ) | ||||
| Shares issued as reinvestment of dividends | 170,702 | 116,599 | ||||||
| Ending Shares | 7,633,842 | 5,867,411 | ||||||
| Class A-2 | ||||||||
| Beginning shares | 47,972 | 4,895 | ||||||
| Shares sold | 912,936 | 41,523 | ||||||
| Shares redeemed | (14,207 | ) | – | |||||
| Shares issued as reinvestment of dividends | 33,561 | 1,554 | ||||||
| Ending Shares | 980,262 | 47,972 | ||||||
| See Notes to Consolidated Financial Statements. | |
| Annual Report | October 31, 2023 | 21 |
| 1WS Credit Income Fund | Consolidated Statement of Cash Flows |
| For the Year Ended October 31, 2023 |
| CASH FLOWS FROM OPERATING ACTIVITIES: | ||||
| Net increase in net assets from operations | $ | 13,913,915 | ||
| Adjustments to reconcile net increase/(decrease) in net assets from operations to net cash provided by (used in) operating activities: | ||||
| Purchases of investment securities | (126,369,371 | ) | ||
| Proceeds from disposition of investment securities | 90,578,184 | |||
| Discounts (accreted)/premiums amortized | 1,125,796 | |||
| Net realized (gain)/loss on: | ||||
| Investment securities | 2,569,178 | |||
| Interest Rate Swaps | (309,564 | ) | ||
| Credit default swap contracts | (1,770,273 | ) | ||
| Futures contracts | (1,030,093 | ) | ||
| Foreign currency transactions | 809,858 | |||
| Net change in unrealized (appreciation)/depreciation on: | ||||
| Investment securities | (4,398,564 | ) | ||
| Translation of assets and liabilities in foreign currency transactions | (31,591 | ) | ||
| Net purchase of short-term investments | (19,073,943 | ) | ||
| Net payments received from (made to) counterparties for derivative contracts | 2,716,335 | |||
| (Increase)/Decrease in assets: | ||||
| Variation margin receivable on centrally cleared swap contracts | (24,215 | ) | ||
| Variation margin receivable on futures contracts | 180,660 | |||
| Interest receivable | (294,771 | ) | ||
| Unrealized appreciation on credit default swap contracts | 79,581 | |||
| Prepaid expenses and other assets | (41,071 | ) | ||
| Increase/(Decrease) in liabilities: | ||||
| Net payable to adviser | (18,958 | ) | ||
| Unrealized depreciation on credit default swap contracts | (410,356 | ) | ||
| Accrued fund accounting and administration fees payable | (35,107 | ) | ||
| Interest payable on reverse repurchase agreements | 81,130 | |||
| Payable for shareholder servicing and distribution fees | 9,466 | |||
| Other payables and accrued expenses | (81,625 | ) | ||
| Net Cash Used in Operating Activities | $ | (41,825,399 | ) | |
| CASH FLOWS FROM FINANCING ACTIVITIES: | ||||
| Cash payments from reverse repurchase agreements | $ | 550,388,613 | ||
| Cash payments for reverse repurchase agreements | (543,631,836 | ) | ||
| Proceeds from shares sold | 60,782,290 | |||
| Cost of shared redeemed | (15,414,900 | ) | ||
| Distributions paid to shareholders | (10,024,573 | ) | ||
| Net Cash Provided by Financing Activities | $ | 42,099,594 | ||
| Effect of exchange rates on cash | $ | (778,267 | ) | |
| Net Decrease in Cash, Restricted Cash and Foreign Rates on Cash | $ | (504,072 | ) | |
| Cash and restricted cash, beginning balance | $ | 5,176,263 | ||
| Cash and restricted cash, ending balance | $ | 4,672,191 | ||
| SUPPLEMENTAL DISCLOSURE OF CASH FLOW INFORMATION: | ||||
| Cash paid on interest expense on reverse repurchase agreements | $ | 2,972,040 | ||
| Reinvestment of distributions | $ | 3,713,909 | ||
| See Notes to Consolidated Financial Statements. | |
| 22 | www.1wscapital.com |
| 1WS Credit Income Fund | Consolidated Statement of Cash Flows |
| For the Year Ended October 31, 2023 |
THE FOLLOWING TABLE PROVIDES A RECONCILIATION OF
RESTRICTED CASH AND UNRESTRICTED CASH AND FOREIGN CURRENCY WITHIN THE CONSOLIDATED STATEMENT OF ASSETS AND LIABILITIES
| October 31, 2023 | October 31, 2022 | |||||||
| Unrestricted cash and foreign currency | $ | 2,748,555 | $ | 832,903 | ||||
| Restricted cash within Deposits held with brokers for derivatives and reverse repurchase agreements | $ | 1,923,636 | $ | 4,343,360 | ||||
| Unrestricted Cash and Restricted Cash(a) | $ | 4,672,191 | $ | 5,176,263 | ||||
| (a) | Restricted cash as of October 31, 2023 includes $271,244 of margin posted as collateral on futures contracts and $1,652,392 margin posted as collateral on credit default and interest rate swap contracts. Restricted cash as of October 31, 2022 includes $1,413,188 of margin posted as collateral on futures contracts and $2,930,172 of margin posted as collateral on credit default and interest rate swap contracts. All collateral is considered to be restricted cash, which is included in Deposits held with brokers for derivatives and reverse repurchase agreements on the Consolidated Statement of Assets and Liabilities. |
See Notes to Consolidated Financial Statements.
| Annual Report | October 31, 2023 | 23 |
| 1WS Credit Income Fund | Consolidated Financial Highlights |
| For a Share Outstanding Throughout the Periods Presented |
| Class I | For the Year Ended October 31, 2023 | For the Year Ended October 31, 2022 | For the Year Ended October 31, 2021 | For the Year Ended October 31, 2020 | For the Period March 4, 2019 (Commencement of Operations) to October 31, 2019 | |||||||||||||||
| PER SHARE OPERATING PERFORMANCE: | ||||||||||||||||||||
| Net asset value – beginning of year/period | $ | 18.86 | $ | 21.62 | $ | 19.22 | $ | 20.38 | $ | 20.00 | ||||||||||
| INCOME/(LOSS) FROM INVESTMENT OPERATIONS: | ||||||||||||||||||||
| Net investment income(a) | 1.37 | 1.47 | 1.08 | 0.59 | 0.35 | |||||||||||||||
| Net realized and unrealized gain/(loss) on investments | 0.62 | (2.23 | ) | 2.52 | (0.55 | ) | 0.63 | |||||||||||||
| Total Income/(Loss) from Investment Operations | 1.99 | (0.76 | ) | 3.60 | 0.04 | 0.98 | ||||||||||||||
| DISTRIBUTIONS TO SHAREHOLDERS: | ||||||||||||||||||||
| From net investment income | (1.20 | ) | (1.30 | ) | (1.20 | ) | (0.77 | ) | (0.60 | ) | ||||||||||
| From net realized gains | (0.85 | ) | (0.70 | ) | – | – | – | |||||||||||||
| From tax return of capital | – | – | – | (0.43 | ) | – | ||||||||||||||
| Total Distributions to Shareholders | (2.05 | ) | (2.00 | ) | (1.20 | ) | (1.20 | ) | (0.60 | ) | ||||||||||
| Net asset value per share – end of year/period | $ | 18.80 | $ | 18.86 | $ | 21.62 | $ | 19.22 | $ | 20.38 | ||||||||||
| Total Investment Return – Net Asset Value(b) | 11.32 | % | (3.78 | %) | 19.10 | % | 0.53 | % | 4.92 | % | ||||||||||
| RATIOS AND SUPPLEMENTAL DATA: | ||||||||||||||||||||
| Net assets attributable to shares, end of year/period (000s) | $ | 143,547 | $ | 110,680 | $ | 110,570 | $ | 86,791 | $ | 73,602 | ||||||||||
| Ratio of actual expenses to average net assets including fee waivers and reimbursements | 4.83 | % | 3.48 | % | 2.84 | % | 2.55 | % | 1.52 | %(c) | ||||||||||
| Ratio of actual expenses to average net assets excluding fee waivers and reimbursements | 5.73 | % | 4.54 | % | 3.73 | % | 4.02 | % | 4.11 | %(c)(d) | ||||||||||
| Ratio of net investment income to average net assets | 7.37 | % | 7.30 | % | 5.17 | % | 3.07 | % | 2.57 | %(c) | ||||||||||
| Portfolio turnover rate | 55.95 | % | 77.20 | % | 107.74 | % | 79.44 | % | 25.84 | %(e) | ||||||||||
| (a) | Calculated using average shares outstanding. |
| (b) | Total investment return is calculated assuming a purchase of a share at the opening on the first day and a sale at closing on the last day of the period reported. Dividends and distributions are assumed for purposes of this calculation to be reinvested at prices obtained under the Fund’s dividend reinvestment plan. Total investment return does not reflect brokerage commissions, if any, and are not annualized. |
| (c) | These ratios to average net assets have been annualized. |
| (d) | These ratios to average net assets have been annualized except the non-recurring organizational expenses which have not been annualized. |
| (e) | Percentage represents the results for the period and is not annualized. |
| See Notes to Consolidated Financial Statements. | |
| 24 | www.1wscapital.com |
1WS Credit Income Fund |
Consolidated Financial Highlights |
| For a Share Outstanding Throughout the Periods Presented |
| Class A-2 | For the Year Ended October 31, 2023 | For the Year Ended October 31, 2022 | For the Period May 1, 2021 (Commencement of Operations) to October 31, 2021 | |||||||||
| PER SHARE OPERATING PERFORMANCE: | ||||||||||||
| Net asset value – beginning of year/period | $ | 18.68 | $ | 21.55 | $ | 21.01 | ||||||
| INCOME/(LOSS) FROM INVESTMENT OPERATIONS: | ||||||||||||
| Net investment income(a) | 1.30 | 1.31 | 0.63 | |||||||||
| Net realized and unrealized gain/(loss) on investments | 0.55 | (2.18 | ) | 0.51 | ||||||||
| Total Income/(Loss) from Investment Operations | 1.85 | (0.87 | ) | 1.14 | ||||||||
| DISTRIBUTIONS TO SHAREHOLDERS: | ||||||||||||
| From net investment income | (1.20 | ) | (1.30 | ) | (0.60 | ) | ||||||
| From net realized gains | (0.85 | ) | (0.70 | ) | – | |||||||
| Total Distributions to Shareholders | (2.05 | ) | (2.00 | ) | (0.60 | ) | ||||||
| Net asset value per share – end of year/period | $ | 18.48 | $ | 18.68 | $ | 21.55 | ||||||
| Total Investment Return – Net Asset Value(b) | 10.64 | % | (4.38 | %) | 5.54 | % | ||||||
| RATIOS AND SUPPLEMENTAL DATA: | ||||||||||||
| Net assets attributable to shares, end of year/period (000s) | $ | 18,119 | $ | 896 | $ | 106 | ||||||
| Ratio of actual expenses to average net assets including fee waivers and reimbursements | 5.46 | % | 4.67 | % | 3.32 | %(c) | ||||||
| Ratio of actual expenses to average net assets excluding fee waivers and reimbursements | 6.30 | % | 5.72 | % | 4.25 | %(c) | ||||||
| Ratio of net investment income to average net assets | 7.05 | % | 6.69 | % | 5.86 | %(c) | ||||||
| Portfolio turnover rate | 55.95 | % | 77.20 | % | 107.74 | %(d) | ||||||
| (a) | Calculated using average shares outstanding. |
| (b) | Total investment return is calculated assuming a purchase of a share at the opening on the first day and a sale at closing on the last day of the period reported. Dividends and distributions are assumed for purposes of this calculation to be reinvested at prices obtained under the Fund’s dividend reinvestment plan. Total investment return does not reflect brokerage commissions, if any, and are not annualized. |
| (c) | These ratios to average net assets have been annualized. |
| (d) | Percentage represents the results for the period and is not annualized. |
See Notes to Consolidated Financial Statements.
| Annual Report | October 31, 2023 | 25 |
| 1WS Credit Income Fund | Notes to Consolidated Financial Statements |
| October 31, 2023 |
NOTE 1. ORGANIZATION
1WS Credit Income Fund (“1WS Credit” or
the “Fund”) is a Delaware statutory trust registered under the Investment Company Act of 1940, as amended (the “1940
Act”), as a non-diversified, closed-end management investment company that continuously offers its shares of beneficial interest
(‘‘Shares’’). 1WS Credit operates as an interval fund under Rule 23c-3 of the 1940 Act and, as such, has adopted
a policy to make quarterly repurchase offers at a price equal to net asset value (‘‘NAV’’) per Share of at least
5% of outstanding Shares.
1WS Credit’s investment objective is to seek
attractive risk-adjusted total returns through generating income and capital appreciation. 1WS Credit will seek to achieve its investment
objective by investing in a wide array of predominantly structured credit and securitized debt instruments. There can be no assurance
that the Fund’s investment objective will be achieved.
1WS Credit was organized as a Delaware statutory trust
on July 20, 2018 pursuant to an Agreement and Declaration of Trust governed by the laws of the State of Delaware. 1WS Credit had no operations
from that date to March 4, 2019, commencement of operations, other than those related to organizational matters and the registration of
its Shares under applicable securities laws. 1WS Credit wholly owns and consolidates 1WSCI Sub I, LLC (the “Cayman Islands SPV”),
an exempted company incorporated in the Cayman Islands on February 22, 2019. The Cayman Islands SPV is an investment vehicle formed to
make certain investments on behalf of 1WS Credit. 1WS Credit is the managing and sole member of the Cayman Islands SPV pursuant to a limited
liability agreement dated March 1, 2019. Where context requires, the “Fund” includes both the Fund and the Cayman Island SPV.
1WS Capital Advisors, LLC (the ‘‘Adviser’’
or ‘‘1WS’’) serves as the investment adviser of the Fund. 1WS is a Delaware limited liability company that is
registered as an investment adviser with the Securities and Exchange Commission (the ‘‘SEC’’) under the Investment
Advisers Act of 1940 (the ‘‘Advisers Act’’). The Adviser is controlled by its managing member, One William Street
Capital Management, L.P. (‘‘OWS’’), which is also registered with the SEC as an investment adviser. The Fund’s
portfolio manager and other personnel of the Adviser have substantial experience in managing investments and investment funds, including
funds which have investment programs similar to that of the Fund.
The Fund currently offers Institutional (“Class
I”) Shares and Brokerage Class (“Class A-2”) Shares (collectively, the “Share Classes”). Both Share Classes
of the Fund are being offered on a continuous basis at the NAV per Share calculated each day. Class A-2 Shares are offered subject to
a maximum sales charge of 3.00% of their offering price and an asset-based distribution/shareholder servicing fee not to exceed 0.75%
of its net assets and Class I shares are not subject to any sales load or asset-based distribution fee. Class A-2 Shares purchased without
a sales charge may be subject to a 1.50% contingent deferred sales charge (“CDSC”). The Fund received exemptive relief from
the SEC to issue multiple classes of Shares and to impose asset-based distribution fees as applicable. Class I and Class A-2 shares commenced
operations on March 4, 2019 and May 1, 2021, respectively.
Each class represents an interest in the same assets
of the Fund and classes are identical except for differences in their sales charge structures and ongoing service and distribution charges.
All classes of shares have equal voting privileges except that each class has exclusive voting rights with respect to its service and/or
distribution plans. The Fund’s income, expenses (other than class specific service and distribution fees) and realized and unrealized
gains and losses are allocated proportionately each day based upon the relative net assets of each class.
NOTE 2. SIGNIFICANT ACCOUNTING POLICIES
Basis of Presentation: The
accompanying consolidated financial statements are prepared in accordance with accounting principles generally accepted in the United
States of America (“GAAP”) and are stated in United States dollars. The Fund is considered an investment company under GAAP
and follows the accounting and reporting guidance for investment companies under Financial Accounting Standards Board’s (‘’FASB’’)
Accounting Standards Codification (‘’ASC’’) 946, Financial Services-Investment Companies, including accounting
for investments at fair value.
The preparation of these consolidated financial statements
in accordance with GAAP requires management to make certain estimates and assumptions that affect the amounts reported in the consolidated
financial statements and accompanying notes. The Adviser believes that the estimates utilized in preparing the financial statements are
reasonable and prudent; however, actual results could differ from such estimates and the differences could be material.
Consolidation: 1WS
Credit consolidates its investment in the Cayman Islands SPV because 1WS Credit is the sole shareholder of this entity. In accordance
with ASC 810, Consolidation, the accompanying consolidated financial statements include the Cayman Islands SPV’s assets and
liabilities and results of operations. All investments held by the Cayman Islands SPV are disclosed in the Consolidated Schedule of Investments.
All intercompany accounts and transactions have been eliminated upon consolidation.
Investment Transactions: Investment transactions
are accounted for on a trade-date basis for financial reporting purposes and amounts payable or receivable for trades not settled at the
time of year end are reflected as liabilities and assets, respectively. Interest is recorded on an accrual basis. Realized gains and losses
on investment transactions reflected in the consolidated statement of operations are recorded on a first-in, first-out basis.
| 1WS Credit Income Fund | Notes to Consolidated Financial Statements |
| October 31, 2023 |
Premiums on fixed-income securities and discounts
on non-distressed fixed-income securities are amortized and recorded within interest income in the consolidated statement of operations.
The Fund may enter into derivative contracts for hedging
purposes or to gain synthetic exposures to certain investments (“Derivatives”). Derivatives are financial instruments whose
values are based on an underlying asset, index, or reference rate and include futures, swaps, swaptions, options, or other financial instruments
with similar characteristics.
The Board of Trustees (the “Board”) has
adopted valuation policies and procedures for the Fund and has delegated the day-to-day responsibility for fair value determinations to
the Adviser, the Fund’s “Valuation Designee” (as such term is defined in Rule 2a-5 of the 1940 Act).
Fund Valuation: Class
I and Class A-2 Shares are offered at NAV. The NAV per share of each class is determined daily. The Fund’s NAV per share is calculated
by subtracting liabilities (including accrued expenses and indebtedness) from the total assets of the Fund (the value of the investments
plus cash or other assets, including interest accrued but not yet received). The Fund’s NAV is then allocated pro-rata between the share
classes, adjusting for share class specific liabilities. The NAV of each share class is then divided by the total number of Shares outstanding
of each share class at each day’s end.
Federal
Income Taxes: The Fund has elected to be treated as a regulated investment company under the Internal
Revenue Code of 1986, as amended (the ‘‘Code’’). The Fund intends to elect to be treated for federal income tax
purposes, and intends to qualify annually, as a regulated investment company (a ‘‘RIC’’) under Subchapter M of
the Internal Revenue Code (the ‘‘Code’’). As a RIC, the Fund generally will not have to pay Fund-level federal
income taxes on any ordinary income or capital gains that the Fund distributes to shareholders from our tax earnings and profits.
For the year ended October 31, 2023, the Fund did
not have a tax liability. The Fund files U.S. federal, state, and local tax returns as required. The Fund’s tax returns are subject
to examination by the relevant tax authorities until expiration of the applicable statute of limitations which is generally three years
after the filing of the tax return for federal purposes and four years for most state returns.
Distributions to Shareholders: The Fund
intends to declare and pay substantially all of its net investment income to shareholders in the form of dividends on a quarterly basis.
The Fund also intends to distribute substantially all net realized capital gains at least annually.
NOTE 3. PORTFOLIO VALUATION
ASC 820 Fair Value Measurement defines fair
value as an exit price representing the amount that would be received to sell an asset or paid to transfer a liability in an orderly transaction
between market participants. ASC 820 establishes a fair value hierarchy for inputs used in measuring fair value and maximizes the use
of observable inputs and minimizes the use of unobservable inputs by prioritizing the use of the most observable input when available.
Valuation inputs broadly refer to the assumptions
market participants would use in pricing the asset or liability, including assumptions about risk. ASC 820 distinguishes between: (i)
observable inputs, which are based on market data obtained from parties independent of the reporting entity, and (ii) unobservable inputs,
which reflect the Adviser’s own assumptions about the judgments market participants would use. A financial instrument’s level
within the fair value hierarchy is based on the lowest level of any input that is deemed significant to the fair value measurement. When
a valuation uses multiple inputs from varying levels of the fair value hierarchy, the hierarchy level is determined based on the lowest
level input that is significant to the fair value measurement in its entirety.
| Level 1— | Inputs that are unadjusted, quoted prices in active markets for identical assets or liabilities. |
| Level 2— | Inputs (other than quoted prices included in Level 1) that are observable, either directly or indirectly. |
| Level 3— | Inputs that are unobservable and reflect the Adviser’s best estimate of what market participants would use in pricing the asset or liability. This includes situations where there is little, if any, market activity for the asset or liability. |
Generally, the Fund expects to be able to obtain pricing
from independent third-party sources on many of its investments. However, in certain circumstances where such inputs are difficult or
impractical to obtain we may fair value certain investments using internal manager marks. As of October 31, 2023, 2.89% of the investments
held by the Fund were valued using internal manager marks.
The following factors may be pertinent in determining
fair value: security covenants, call protection provisions and information rights; cash flows, the nature and realizable value of any
collateral; the debt instrument’s ability to make payments; the principal markets and financial environment in which the debt instrument
operates; publicly available financial ratios of peer companies; changes in interest rates for similar debt instruments; and enterprise
values, among other relevant factors.
| Annual Report | October 31, 2023 | 27 |
| 1WS Credit Income Fund | Notes to Consolidated Financial Statements |
| October 31, 2023 |
Determination of fair value involves subjective judgments
and estimates. Due to the inherent uncertainty of determining the fair value of investments that do not have readily available market
quotations, the fair value of these investments may differ significantly from the values that would have been used had such market quotations
existed for such investments, and any such differences could be material. Accordingly, under current accounting standards, the notes to
the Fund’s consolidated financial statements will refer to the uncertainty with respect to the possible effect of such valuations,
and any change in such valuations, on the Fund’s financial statements.
The following tables summarize the Fund’s financial
instruments classified as assets and liabilities measured at fair value by level within the fair value hierarchy as of October 31, 2023:
| Investments in Securities at Value | Level 1 | Level 2 | Level 3 | Total | ||||||||||||
| Residential Mortgage-Backed Securities | $ | – | $ | 55,149,241 | $ | – | $ | 55,149,241 | ||||||||
| Commercial Mortgage-Backed Securities | – | 32,184,219 | 4,070,067 | 36,254,286 | ||||||||||||
| Asset-Backed Securities | – | 77,270,949 | 9,039,208 | 86,310,157 | ||||||||||||
| Collateralized Loan Obligations | – | 6,018,371 | 905,510 | 6,923,881 | ||||||||||||
| Preferred Stocks | 532,849 | – | – | 532,849 | ||||||||||||
| Money Market Funds | 27,652,995 | – | – | 27,652,995 | ||||||||||||
| Total | $ | 28,185,844 | $ | 170,622,780 | $ | 14,014,785 | $ | 212,823,409 | ||||||||
| Derivative Instruments | ||||||||||||||||
| Assets: | ||||||||||||||||
| Credit Default Swap Contracts | $ | – | $ | 26,625 | $ | – | $ | 26,625 | ||||||||
| Interest Rate Swap Contracts | – | 1,432,334 | – | 1,432,334 | ||||||||||||
| Future Contracts | 702,768 | – | – | 702,768 | ||||||||||||
| Liabilities: | ||||||||||||||||
| Future Contracts | $ | (1,029 | ) | – | – | $ | (1,029 | ) | ||||||||
| Credit Default Swap Contracts | – | (95,610 | ) | – | (95,610 | ) | ||||||||||
| Total | $ | 701,739 | $ | 1,363,349 | $ | – | $ | 2,065,088 | ||||||||
There were no changes in valuation technique.
The following table discloses the purchase of Level
3 portfolio investments as well as the value of transfers into or out of Level 3 for the year ended October 31, 2023 of the Fund’s
Level 3 portfolio investments:
| Asset-Backed Securities | Collateralized Loan Obligations | Commercial Mortgage-Backed Securities | Total | |||||||||||||
| Balance as of October 31, 2022 | $ | 13,439,219 | $ | 4,418,860 | $ | 2,000,000 | $ | 19,858,079 | ||||||||
| Accrued discount/premium | (1,816,228 | ) | 127,266 | – | (1,688,962 | ) | ||||||||||
| Realized Gain/(Loss) | (1,081,829 | ) | (1,600,852 | ) | – | (2,682,681 | ) | |||||||||
| Change in Unrealized Appreciation/(Depreciation) | (1,299,263 | ) | 1,081,154 | 45,454 | (172,655 | ) | ||||||||||
| Purchases | 3,653,224 | 154,905 | 2,024,613 | 5,832,742 | ||||||||||||
| Sales Proceeds | (3,855,915 | ) | (3,275,823 | ) | – | (7,131,738 | ) | |||||||||
| Transfer into Level 3 | – | – | – | – | ||||||||||||
| Transfer out of Level 3 | – | – | – | – | ||||||||||||
| Balance as of October 31, 2023 | $ | 9,039,208 | $ | 905,510 | $ | 4,070,067 | $ | 14,014,785 | ||||||||
| Net change in unrealized appreciation/(depreciation) included in the Statement of Operations attributable to Level 3 investments held at October 31, 2023 | $ | (2,167,316 | ) | $ | 42,627 | $ | 45,454 | $ | (2,079,235 | ) | ||||||
| 1WS Credit Income Fund | Notes to Consolidated Financial Statements |
| October 31, 2023 |
The following table presents additional information
about the valuation methodologies and inputs used for investments that are measured at fair value and categorized within Level 3 as of
October 31, 2023:
Quantitative Information about Level 3 Fair Value Measurements
| Asset Class | Fair Value | Valuation Technique | Unobservable Inputs | Value/Range |
| Asset-Backed Securities | $ 6,955,708 | Broker Pricing | Indicative Quotes | $9 – $65,306(1) |
| Asset-Backed Securities | $ 2,083,500 | Internal Model | Loss Severity analysis | $100(2) |
| Collateralized Loan Obligations | $ 905,510 | Broker Pricing | Indicative Quotes | $64 |
| Commercial Mortgage-Backed Securities | $ 4,070,067 | Internal Model | Loss Severity analysis | $100(3) |
| (1) | Input is based on the total market value of the outstanding loan, of which the Fund owns 0.38% – 9.87%. |
| (2) | Input is based on modeled delinquencies of the underlying collateral. |
| (3) | Inputs are based on yields ranging from 11.80% – 13.79%. |
NOTE 4. FEES AND EXPENSES INCLUDING RELATED PARTY TRANSACTIONS
Related
Party Fees and Expenses
Investment Advisory: Under
an investment advisory agreement between the Fund and the Adviser (the “Advisory Agreement”), the Fund pays the Adviser a
fee at the annualized rate of 1.50% of the daily gross assets of the Fund (the “Management Fee”). For the one-year period
beginning on March 1, 2023, the Adviser has voluntarily agreed to reduce the Management Fee to 1.25% of the Fund’s daily gross assets.
Expense Limitation and Reimbursement Agreement:
Pursuant to an expense limitation and reimbursement agreement (the “Expense Limitation Agreement”),
the Adviser agrees to waive the fees payable to it under the Investment Advisory Agreement and/or to pay or absorb operating expenses
of the Fund, including, without limitation, organization and offering expenses (excluding brokerage and transactional expenses; borrowing
and other investment-related costs and fees including interest and commitment fees; short dividend expense; acquired fund fees; taxes;
litigation and indemnification expenses; judgments; and extraordinary expenses not incurred in the ordinary course of the Fund’s
business – collectively, the “Exclusions”), to the extent necessary to limit the Other Expenses of the Fund (as set
forth in the Fund’s Prospectus) less the Exclusions to 0.50% per annum of the Fund’s daily gross assets. The Adviser shall
be permitted to recoup in later periods Fund expenses that the Adviser has paid or otherwise borne to the extent that the expenses for
the Fund fall below the annual limitation rate in effect at the time of the actual waiver/reimbursement and to the extent that they do
not cause the Fund to exceed the annual rate in effect at the time of the recoupment. Under the Expense Limitation Agreement, the Adviser
is not permitted to recoup such expenses beyond three years from the date on which the Adviser reduced a fee or reimbursed an expense.
The Expense Limitation Agreement will remain in effect until March 1, 2024, unless and until the Trustees approve its modification or
termination.
As of October 31, 2023, the advisor reimbursed fees under the Expense Limitation
Agreement which are recoupable as follows:
| Expired October 31, 2023 | Expires October 31, 2024 | Expires October 31, 2025 | Expires October 31, 2026 |
| $775,982 | $580,191 | $810,698 | $712,874 |
Other Fees and Expenses
Officer and Trustee Compensation: The
Fund pays each member of the Board of Trustees who is not a director, officer, employee or affiliate of OWS a $25,000 annual retainer,
$2,500 per board meeting and $1,000 for each committee meeting. None of the executive officers receive compensation from the Fund.
Distribution and Servicing Fees: The
Fund has entered into a distribution agreement (the ‘‘Distribution Agreement’’) with ALPS Distributors, Inc. (the
‘‘Distributor’’), pursuant to which the Distributor is serving as the Fund’s principal underwriter and acts
as the distributor of the Fund’s Shares on a best efforts basis, subject to various conditions.
Class A-2 Shares of the Fund are subject to ongoing
distribution and shareholder servicing fees that may be used to compensate Intermediaries for selling shares of the Fund, and providing,
or arranging for the provision of, Shareholder Services (the “Shareholder Servicing Fees”), and ongoing distribution and/or
marketing services to the Fund (the “Distribution Fees”). The Distribution Fees and Shareholder Servicing Fees, as applicable,
are accrued daily and paid monthly in an amount not to exceed, in the aggregate for Class A-2 Shares, 0.75% (on an annualized basis) of
the net asset value of Class A-2 Shares of the Fund. For each class of shares of the Fund, under no circumstances shall Shareholder Servicing
Fees exceed 0.25% of the net asset value of such class. The Distribution Fees and Shareholder Servicing Fees will be accrued daily as
an expense of the Fund. For the year ended October 31, 2023, Class A-2 shares expensed $57,351 for Shareholder Servicing Fees and Distribution
Fees.
| Annual Report | October 31, 2023 | 29 |
| 1WS Credit Income Fund | Notes to Consolidated Financial Statements |
| October 31, 2023 |
Fund Administration and Accounting Fees and Expenses:
ALPS Fund Services, Inc. (“ALPS” or the “Administrator”) serves as the Fund’s
administrator and provides various administration, fund accounting, investor accounting and taxation services to the Fund (which are in
addition to the services provided by the Adviser, as described above). In consideration of these services, the Fund pays the Administrator,
on a monthly basis. The Fund will reimburse the Administrator for certain out-of-pocket expenses incurred on behalf of the Fund.
Compliance Fees: ALPS
Fund Services, Inc. provides Chief Compliance Officer Services to the Fund. Additionally, ALPS provides services in monitoring and testing
the policies and procedures of the Fund in conjunction with requirements under Rule 38a-1 under the 1940 Act. ALPS is compensated under
the Chief Compliance Officer Services Agreement.
Legal Fees: Kramer Levin Naftalis
& Frankel LLP serves as counsel to the Fund.
Audit Fees: Deloitte
& Touche LLP acts as independent registered public accountant for the Fund and in such capacity audits the Fund’s annual consolidated
financial statements.
Custodian: The Bank of New York Mellon
serves as the Fund’s primary custodian.
Transfer Agent: DST
Systems, Inc. (“DST”), the parent company of ALPS, serves as the Transfer Agent to the Fund. Under the Transfer Agency Agreement,
DST is responsible for maintaining all shareholder records of the Fund. DST is a wholly-owned subsidiary of SS&C Technologies Holdings,
Inc. (“SS&C”), a publicly traded company listed on the NASDAQ Global Select Market.
NOTE 5. SECURITIES TRANSACTIONS
Purchases and sales of investments, excluding short-term
obligations and including maturities and paydowns, transacted for the year ended October 31, 2023, were as follows:
| Cost of Investments Purchased | Proceeds from Investments Sold |
| $ 125,310,552 | $ 89,940,839 |
NOTE 6. INVESTMENTS
Under normal investment conditions, the Fund will invest at least 80% of
its assets (including borrowings for investment purposes) in debt obligations.
The securities/instruments acquired by the Fund may
include all types of debt and other obligations (‘‘Credit Investments’’), and may have varying terms with respect
to collateralization, seniority or subordination, purchase price, convertibility, interest payments and maturity, and may consist of the
following: (i) residential and commercial mortgage-backed securities (‘‘MBS’’), as well as real estate loans or
pools of such loans; (ii) asset-backed securities (‘‘ABS’’), or other instruments secured by financial, physical,
and/or intangible assets (e.g., receivables or pools of receivables), and investments in any assets/instruments underlying the foregoing
structured/secured obligations; (iii) debt and subordinated tranches of collateralized loan obligations (‘‘CLOs’’)
and collateralized debt obligations (‘‘CDOs’’); (iv) public and private senior and mezzanine, senior secured or
unsecured bonds/loans; and (v) other income producing securities, including investment grade debt, debentures and notes, and deferred
interest, payment-in-kind or zero coupon bonds/notes. The Fund may invest without limit in CLOs or CDOs, including the subordinated tranches
of such vehicles.
The Fund may also invest indirectly in any of the
foregoing instruments through: (i) investing in other funds, including exchange traded funds (‘‘ETFs’’) and up
to 15% of its net assets in funds that are excluded from the definition of ‘‘investment company’’ under the 1940
Act solely by reason of Section 3(c)(1) or Section 3(c)(7) of the 1940 Act, that are primarily invested in Credit Investments (except
that investments in MBS, ABS, CLOs or CDOs and other Credit Investments that are not hedge funds or private equity funds are not subject
to such 15% limitation); or (ii) entering into derivatives, including long and short positions in credit default swaps, total return swaps,
forward contracts, futures and other similar transactions. The Fund may also use derivatives for cash management purposes, to modify interest
rate exposure or to hedge positions. The Fund may invest in derivatives without limit, subject to adherence to applicable asset coverage
and/or segregation requirements of the 1940 Act. (The Fund counts the foregoing indirect investments in debt obligations towards the Fund’s
requirement to invest at least 80% of its assets in debt obligations.) The Fund may invest in derivatives subject to the limitations set
forth in Rule 18f-4 under the 1940 Act.
| 1WS Credit Income Fund | Notes to Consolidated Financial Statements |
| October 31, 2023 |
The Fund anticipates that many Credit Investments
will be rated below investment grade by rating agencies or would be rated below investment grade if they were rated. Credit Investments
that are rated below investment grade (commonly referred to as ‘‘high yield’’ securities or ‘‘junk
bonds’’) are regarded as having predominantly speculative characteristics with respect to the issuer’s capacity to pay
interest and repay principal.
In seeking to achieve the Fund’s objective,
the Fund may also invest a portion of its net assets in (i) U.S. and foreign government obligations, and highly-rated debt instruments
(e.g., commercial paper); and (ii) long and short positions in public or private equity securities, which can include ETFs and real estate
investment trusts.
The Fund intends to add leverage to its portfolio
through direct borrowing and/or through entering into reverse repurchase agreements. Certain of the Fund’s investments may require
leverage to achieve the desired risk-adjusted return profile deployed by the Fund.
At any given time, a substantial portion of our portfolio
may be illiquid, subjecting the Fund to increased credit risk. If a borrower or obligor or other counterparty on an instrument underlying
a Credit Investment is unable to make its payments, we may be greatly limited in our ability to recover any outstanding principal and
interest (or other applicable amounts) under such Credit Investment. Our Shares therefore should be purchased only by investors who could
afford a possible substantial loss of their investment. There is no geographic or currency limitation on the securities or instruments
acquired by the Fund. The Fund may purchase debt or equity securities of non-U.S. governments and corporate entities domiciled outside
of the United States, including emerging markets issuers.
NOTE 7. DERIVATIVE INSTRUMENTS
The Fund may enter into derivative transactions in
connection with its investing activities. These instruments derive their value, primarily or partially, from the underlying asset, indices,
reference rate, or a combination of these factors. Derivatives are subject to various risks similar to non-derivative instruments, such
as interest, market, and credit risk.
The Fund is subject to interest rate exposures, both
directly and indirectly. Direct interest rate exposure can result from holding fixed rate bonds, the value of which may decrease if interest
rates rise. Additionally, indirect interest rate exposure can result from certain securitization transactions that contain mismatches
between the rate of interest earned on the underlying loans and/or receivables as compared to the rate of interest due on the securities.
To hedge this risk for cases in which the Fund deems it effective, the Fund may enter into futures contracts, interest rate swaps, other
interest rate options, or securities sold, not yet purchased.
The Fund is also subject to credit risk in the normal
course of pursuing its investment objectives. In addition to the specific credit risk, in particular investment securities, the Fund is
exposed to broader market credit risk. To hedge this risk, the Fund may enter into a variety of instruments, including credit default
swaps, futures, options, and swaptions.
The market value of derivative instruments generally
may change in a manner that amplify market movements relative to the underlying asset or reference rate. As a result of adverse market
movements, the Fund’s derivatives instruments could cause the Fund to suffer losses that magnify the market value changes of the
underlying asset or reference rate. This use of embedded leverage allows the Fund to increase its market value exposure relative to its
net assets and can substantially increase the volatility of the Fund’s performance.
Additionally, in instances where the Fund is using
derivatives to hedge risk exposures held by the Fund, there are also risks that those derivatives may not perform as expected relative
to the Fund positions intended to be hedged which could result in losses for the hedged positions.
Derivatives are also subject to the risk of possible
regulatory changes which could adversely affect the availability and performance of derivative securities, make them more costly and limit
or restrict their use by the Fund, which could prevent the Fund from implementing its investment strategies and adversely affect returns.
Futures Contracts: Futures
contracts are commitments to either purchase or sell a financial instrument or commodity at a future date for a specified price. Upon
entering into futures contracts, the Fund is required to deposit with the broker, either in cash or securities, an initial margin in an
amount equal to a certain percentage of the contract amount. Subsequent changes in market value of the contract (which may require additional
margin to be deposited) are recorded for financial statement purposes as unrealized gains or losses.
The Fund may use futures contracts to hedge against
changes in the value of financial instruments or changes in interest rates. Upon entering into such futures contracts, the Fund bears
the risk of interest rates or financial instruments’ prices moving adversely to the positions. With futures, counterparty risk is
mitigated as these contracts are exchange-traded and the exchange’s clearinghouse guarantees against non-performance by the counterparty.
| Annual Report | October 31, 2023 | 31 |
| 1WS Credit Income Fund | Notes to Consolidated Financial Statements |
| October 31, 2023 |
Credit Default Swaps and Credit Default Tranches:
In a typical credit default swap, the Fund receives (if a buyer) or provides (if a seller) protection against
certain credit events involving one or more specified reference entities. The buyer of a credit default swap is generally obligated to
pay the seller a periodic stream of payments over the term of the contract in return for a contingent payment upon the occurrence of a
defined credit event on the reference obligation which may be a single security, a basket of securities, or a specified credit index.
The applicable credit events are established at the inception of the transaction and generally include bankruptcy, insolvency, and failure
to meet payment obligations when due, among other events. After a credit event occurs, the contingent payment payable by the seller to
the buyer may be mitigated or reduced by segregated collateral and netting arrangements between the counterparties to the transaction.
A credit default tranche is a type of credit default
swap that allows an investor to gain exposure to a particular portion of the loss distribution on a specified credit index. Tranches are
defined by attachment and detachment points that specify the range of exposure to which an investor is receiving or providing protection
with respect to the specified credit index.
The Fund may enter into credit default swaps or credit
default tranches to hedge against changes in the value of, or to gain exposure to, the market, certain sectors of the market, or specific
issuers. Upon the occurrence of a defined credit event, the difference between the value of the reference obligation and the swap’s
notional amount is recorded as realized gain or loss. Upon entering into a credit default swap, as a seller of protection or a buyer of
protection, the Fund bears exposure to changes in market pricing of risk related to the reference obligations. Additionally, the Fund
is exposed to counterparty risk to the extent the fair value of the credit default swap exceeds the collateral posted. Credit default
swaps are either centrally cleared swaps or executed bilaterally under standard form ISDA master agreements entered into with each counterparty.
Centrally Cleared Swaps are marked to market daily
based upon valuations as determined from the underlying contract or in accordance with the requirements of the central counterparty or
derivatives clearing organization. Changes in market value, if any, are reflected as a component of net change in unrealized appreciation
(depreciation) on the Consolidated Statement of Operations. Daily changes in valuation of centrally cleared swaps, if any, are disclosed
within variation margin receivable/payable on centrally cleared swap contracts on the Consolidated Statement of Assets and Liabilities.
Centrally Cleared and OTC swap payments received or paid at the beginning of the measurement period are included on the Consolidated Statement
of Assets and Liabilities and represent premiums paid or received upon entering into the swap agreement to compensate for differences
between the stated terms of the swap agreement and prevailing market conditions (credit spreads, currency exchange rates, interest rates,
and other relevant factors). Upfront premiums received (paid) are initially recorded as liabilities (assets) and subsequently marked to
market to reflect the current value of the swap. These upfront premiums are recorded as realized gain (loss) on the Consolidated Statement
of Operations upon termination or maturity of the swap. A liquidation payment received or made at the termination of the swap is recorded
as realized gain (loss) on the Consolidated Statement of Operations. Net periodic payments received or paid by a Fund are included as
part of realized gain (loss) on the Consolidated Statement of Operations. For credit default swap contracts, the upfront payments serve
as an indicator of the current status of the payment/performance risk. The fair value of a credit default swap contract represents the
amount of upfront payment that would be required to enter into such swap as of a measurement date. Upfront payments vary inversely to
the price of debt issued by the reference entity. Increasing fair values for credit default swap contracts, in absolute terms when compared
to the notional amount of the swap, represent a deterioration of the market pricing of the reference entity’s debt.
The following is a summary of the derivative instruments
fair value and the location and effect of derivative instruments held directly by the Fund for the year ended October 31, 2023:
| Consolidated Statement of Assets and Liabilities | Consolidated Statement of Operations | |||||||||||||||
| Derivative Assets Fair Value(a) | Derivative Liabilities Fair Value(a) | Net Realized Gain/ (Loss) | Net Change in Unrealized Appreciation / (Depreciation) | |||||||||||||
| Credit default swap contracts | $ | 26,625 | $ | (95,610 | ) | $ | 1,770,273 | $ | 47,716 | |||||||
| Interest swap contracts | 1,432,334 | – | 309,564 | 1,403,765 | ||||||||||||
| Futures contracts | 702,768 | (1,029 | ) | 1,030,093 | (1,315,184 | ) | ||||||||||
| Total derivatives | $ | 2,161,727 | $ | (96,639 | ) | $ | 3,109,930 | $ | 136,297 | |||||||
| (a) | Includes the cumulative appreciation/depreciation of futures contracts and swap contracts as reported in the Consolidated Schedule of Investments. Only the current day’s variation margin receivable of $102,339 for futures, $19,847 for credit default swaps and $50,183 for interest rate swaps is reported within the Consolidated Statement of Assets and Liabilities. Total cumulative appreciation/depreciation on futures contracts as shown on the table above is reported on the Consolidated Statement of Investments. |
| 1WS Credit Income Fund | Notes to Consolidated Financial Statements |
| October 31, 2023 |
The average short notional value and number of short
futures contracts outstanding during the year ended October 31, 2023 was $46,528,526 and 455, respectively. The average notional value
of credit default swap contracts related to the sale and buy protection outstanding during the year ended October 31, 2023 was ($23,264,744)
and $13,667,977 respectively. The average notional value of interest rate swap contracts outstanding during the year ended October 31,
2023 was $302,445.
Offsetting Arrangements: Certain
derivative contracts and reverse repurchase agreements are executed under standardized netting agreements. A netting arrangement creates
an enforceable right of set-off that becomes effective, and affects the realization of settlement on individual assets, liabilities and
collateral amounts, only following a specified event of default or early termination. Default events may include the failure to make payments
or deliver securities timely, material adverse changes in financial condition or insolvency, the breach of minimum regulatory capital
requirements, or loss of license, charter or other legal authorization necessary to perform under the contract. These agreements mitigate
counterparty credit risk by providing for a single net settlement with a counterparty of all financial transactions covered by the agreement
in an event of default as defined under such agreement. The Fund invests in futures, interest rate swaps and credit default swaps that
are centrally cleared and not subject to master netting agreements, thus are not included on the tables below.
| Offsetting of Derivatives and Reverse Repurchase Agreements Assets |
| October 31, 2023 |
| Gross Amounts Not Offset in the Consolidated Statements of Assets and Liabilities | ||||||||||||||||||||||||
| Gross Amounts of Recognized Assets | Gross Amounts Offset in the Consolidated Statements of Assets and Liabilities | Net Amounts Presented in the Consolidated Statements of Assets and Liabilities | Financial Instruments(a) | Cash Collateral Received(a) | Net Amount Receivable | |||||||||||||||||||
| Credit default swap contracts | $ | 26,625 | $ | – | $ | 26,625 | $ | (26,625 | ) | $ | – | $ | – | |||||||||||
| Total | $ | 26,625 | $ | – | $ | 26,625 | $ | (26,625 | ) | $ | – | $ | – | |||||||||||
| Offsetting of Derivatives and Reverse Repurchase Agreements Liabilities |
| October 31, 2023 |
| Gross Amounts Not Offset in the Consolidated Statement of Assets and Liabilities | ||||||||||||||||||||||||
| Gross Amounts of Recognized Liabilities | Gross Amounts Offset in the Consolidated Statement of Assets and Liabilities | Net Amounts Presented in the Consolidated Statement of Assets and Liabilities | Financial Instruments(a) | Cash Collateral Pledged(a) | Net Amount Payable | |||||||||||||||||||
| Credit default swap contracts | $ | 95,610 | $ | – | $ | 95,610 | $ | (95,610 | ) | $ | – | $ | – | |||||||||||
| Reverse repurchase agreements | 57,005,151 | – | 57,005,151 | (57,005,151 | ) | – | – | |||||||||||||||||
| Total | $ | 57,100,761 | $ | – | $ | 57,100,761 | $ | (57,100,761 | ) | $ | – | $ | – | |||||||||||
| (a) | These amounts are limited to the derivatives asset/liability balance and, accordingly, do not include excess collateral received/pledged. |
| Annual Report | October 31, 2023 | 33 |
| 1WS Credit Income Fund | Notes to Consolidated Financial Statements |
| October 31, 2023 |
NOTE 8. LEVERAGE
The Fund may obtain leverage in seeking to achieve its investment objective,
including obtaining financing to make investments in Credit Investments.
The Fund may obtain leverage through direct borrowing and/or through entering
into reverse repurchase agreements.
In a reverse repurchase agreement, the Fund delivers
a security in exchange for cash to a financial institution, the counterparty, with a simultaneous agreement to repurchase the same or
substantially the same security at an agreed upon price and date. Reverse repurchase agreements are generally recorded at their contractual
amounts, including accrued interest, as specified in each respective agreement. Securities sold are held on terms that may permit the
counterparty to sell or re-pledge the securities subject to certain limitations. Such securities sold are held as collateral and are generally
valued daily by the counterparty. The Fund may be required to deliver additional collateral or may demand the counterparty to return collateral
pledged, as deemed necessary to ensure that the fair value of the underlying collateral remains sufficient to cover the contractual amount.
Cash received in exchange for securities delivered plus accrued interest payments to be made by the Fund to counterparties are reflected
as a liability on the Consolidated Statement of Assets and Liabilities. Interest payments made by the Fund to counterparties are recorded
as a component of interest expense on the Consolidated Statement of Operations. The total amount of securities pledged, or partially pledged,
at October 31, 2023 was $89,985,854. During the year ended October 31, 2023, the average amount of reverse repurchase agreements outstanding
was $50,268,319, at a weighted average interest rate of 5.92%.
The following table indicates the total amount of
reverse repurchase agreements, including accrued interest, reconciled to the Fund’s liability as of October 31, 2023:
| 30-90 days | Greater than 90 days | Total | ||||||||||
| Residential Mortgage-Backed Securities | $ | 14,468,568 | $ | 5,803,872 | $ | 20,272,440 | ||||||
| Commercial Mortgage-Backed Securities | 9,091,436 | 1,046,937 | 10,138,373 | |||||||||
| Asset Backed Securities | 23,447,505 | 1,660,271 | 25,107,776 | |||||||||
| Collateralized Loan Obligations | 1,486,562 | – | 1,486,562 | |||||||||
| Total | $ | 48,494,071 | $ | 8,511,080 | $ | 57,005,151 | ||||||
| * | The total reverse repurchase agreement balance of $57,005,151 has financing with extendable provisions that automatically renew per the respective reverse repurchase agreements. |
Leverage can have the effect of magnifying the Fund’s
exposure to changes in the value of its assets and may also result in increased volatility in the Fund’s NAV. This means the Fund
will have the potential for greater gains, as well as the potential for greater losses, than if the Fund owned its assets on an unleveraged
basis. The value of an investment in the Fund will be more volatile and other risks tend to be compounded if and to the extent that the
Fund is exposed to leverage directly or indirectly.
NOTE 9. REPURCHASE OFFERS
The Fund is an interval fund and, as such, has adopted
a fundamental policy to make quarterly repurchase offers at a price equal to the NAV per Share as of the Repurchase Pricing Date (i.e.,
the date that will be used to determine the Fund’s NAV applicable to the repurchase offer), of between 5% and 25% of the Shares
outstanding. Subject to applicable law and approval of the Board, for each quarterly repurchase offer, the Fund currently expects to offer
to repurchase 5% of the Fund’s outstanding Shares at NAV, which is the minimum amount permitted. The Fund will make quarterly repurchase
offers in the months of March, June, September and December. There is no guarantee that shareholders will be able to sell all of the shares
they desire in a repurchase offer because shareholders, in total, may wish to sell more than the percentage of the Fund’s Shares
being repurchased.
During the year ended October 31, 2023, the Fund completed
four quarterly repurchase offers. In each offer, the Fund offered to repurchase no less than 5% of the number of its outstanding Shares
as of the Repurchase Pricing Date. No repurchase offers during the year ended October 31, 2023 were oversubscribed. The result of these
repurchase offers were as follows:
| Repurchase Offer #1 | Repurchase Offer #2 | Repurchase Offer #3 | Repurchase Offer #4 | |
| Repurchase Commencement Date | 12/21/2022 | 03/21/2023 | 06/20/2023 | 09/19/2023 |
| Repurchase Request Deadline | 01/12/2023 | 04/12/2023 | 07/12/2023 | 10/11/2023 |
| Repurchase Pricing Date | 01/12/2023 | 04/12/2023 | 07/12/2023 | 10/11/2023 |
| Repurchased Amount | $4,939,855 | $3,685,312 | $3,092,410 | $3,697,323 |
| Repurchased Shares | 272,469 | 203,383 | 166,977 | 196,274 |
| 1WS Credit Income Fund | Notes to Consolidated Financial Statements |
| October 31, 2023 |
NOTE 10. PRINCIPAL RISKS
In the normal course of business, the Fund invests
in financial instruments and enters into financial transactions where risk of potential loss may exist from things such as changes in
the market (market risk) or failure or inability of the other party to a transaction to perform (credit and counterparty risk). See below
for a detailed description of select principal risks. For a more comprehensive list of potential risks the Fund may be subject to, please
refer to the Fund’s Prospectus and Statement of Additional Information (“SAI”).
Investment and Market Risk: The Fund may invest
in credit-sensitive investments. Until such investments are sold or mature, the Fund is exposed to risks, including interest rate and
spread risks, as well as credit and structural risks relating to whether the cash flows from the underlying assets will be sufficient
in amount and timing to make expected payments on the securities. The Adviser monitors the risk parameters and expected volatility of
the Fund’s overall portfolio and attempts to manage concentrations of the portfolio in any particular investment holding, strategy,
or market. Additionally, the Adviser seeks to control portfolio risks through selective sizing of positions based on a regular evaluation
of each investment’s risk and reward characteristics. Regular mark-to-market portfolio monitoring helps the Adviser monitor the
investments. The Adviser has also developed a proprietary risk management system and uses statistical and cash flow models to monitor
portfolio risk, as well as individual position specific risk.
While the Adviser generally seeks to hedge certain
portfolio risks, the Adviser will not, in general, attempt to hedge all market, interest rate or other risks in the portfolio, and it
may elect to only partially hedge certain risks. Specifically, the Adviser may determine that it is economically unattractive, or otherwise
undesirable, to hedge certain risks and instead may rely on diversification to offset such risks.
Repurchase Offers Risk: An
investment in the Fund is suitable only for long-term investors who can bear the risks associated with the limited liquidity of the Shares.
The Fund is an “interval fund” and, in order to provide liquidity to shareholders, the Fund, subject to applicable law, will
conduct repurchase offers of the Fund’s outstanding Shares at NAV, subject to approval of the Board. The Fund believes that these
repurchase offers are generally beneficial to the Fund’s shareholders, and repurchases generally will be funded from available cash,
cash from the sale of Shares or sales of portfolio securities. However, repurchase offers and the need to fund repurchase obligations
may affect the ability of the Fund to be fully invested or force the Fund to maintain a higher percentage of its assets in liquid investments,
which may harm the Fund’s investment performance. Moreover, diminution in the size of the Fund through repurchases may result in
untimely sales of portfolio securities (with associated imputed transaction costs, which may be significant), and may limit the ability
of the Fund to participate in new investment opportunities or to achieve its investment objective. The Fund may accumulate cash by holding
back (i.e., not reinvesting) payments received in connection with the Fund’s investments and cash from the sale of Shares. The Fund
believes that it can meet the maximum potential amount of the Fund’s repurchase obligations. If at any time cash and other liquid
assets held by the Fund are not sufficient to meet the Fund’s repurchase obligations, the Fund intends, if necessary, to sell investments.
In addition, if the Fund borrows to finance repurchases, interest on that borrowing will negatively affect shareholders who do not tender
their Shares by increasing the Fund’s expenses and reducing any net investment income.
Leverage Risk: Under
current market conditions, the Fund may utilize leverage principally through outstanding senior securities representing indebtedness (“Borrowings”).
The Fund may obtain leverage through direct borrowing and/or through entering into reverse repurchase agreements that create leverage.
Reverse repurchase agreements are agreements in which a Fund sells a security to a counterparty, such as a bank or broker-dealer, in
return for cash and agrees to repurchase that security at a mutually agreed upon price and time. Reverse repurchase agreements carry the
risk that the market value of the security sold by the Fund may decline in value, requiring the Fund to post the additional collateral
or to repurchase the security. Reverse repurchase agreements also may be viewed as a form of borrowing, and borrowed assets used for investment
creates leverage risk. Leverage can create an interest expense that may lower the Fund’s overall returns. Leverage presents the
opportunity for increased net income and capital gains, but may also exaggerate the Fund’s volatility and risk of loss.
Counterparty Credit Risk: The
Fund attempts to control credit risk exposure to trading counterparties and brokers through internal monitoring procedures. A significant
portion of the Fund’s positions, including cash, are held at major financial institutions. All security transactions of the Fund
are transacted with approved brokers and cleared through major securities firms. In the event the brokers are unable to fulfill their
obligations, the Fund could be subject to credit risk.
A primary difference in risks associated with bilateral
OTC contracts and exchange-traded contracts/centrally cleared swaps involves the nature of credit and liquidity risks. Unlike exchange-traded
instruments or centrally cleared swaps, in which performance may be backed by the exchange or clearing corporation, bilateral OTC contracts
require the performance of a specific counterparty and it’s posting of collateral. In the event of a default by such counterparty,
the Fund could be exposed to potential losses. The Fund seeks to reduce its credit risk on bilateral OTC contracts by only transacting
with high credit-standing counterparties. In addition, the Fund further mitigates the risk of counterparty non- performance by requiring
counterparties to pledge cash and/or securities to collateralize unrealized gains on bilateral OTC contracts, in accordance with the terms
of International Swaps and Derivatives Association (“ISDA”) agreements.
Liquidity Risk: The
Fund needs cash liquidity in order to settle trading obligations, meet margin calls on derivatives, meeting margin calls and repayments
on maturing financial arrangements, and meet repurchase offers. The Adviser actively monitors and manages the current and future sources
of and draws on liquidity (cash and cash equivalents) as well as liquid securities.
| Annual Report | October 31, 2023 | 35 |
| 1WS Credit Income Fund | Notes to Consolidated Financial Statements |
| October 31, 2023 |
Credit Risk: Credit
risk is the risk that the value of debt securities in the Fund’s portfolio may decline because the issuer may default and fail to
pay interest or repay principal when due. Rating agencies assign credit ratings to debt securities to indicate their credit risk. Lower
rated or unrated debt securities held by the Fund may present increased credit risk as compared to higher-rated debt securities.
Non-Diversified Fund Risk: The
Fund is classified as “non-diversified” under the 1940 Act. As a result, the Fund can invest a greater portion of its assets
in obligations of a single issuer than a “diversified” fund. The Fund may therefore be more susceptible than a diversified
fund to being adversely affected by any single corporate, economic, political or regulatory occurrence.
Interest Rate Risk: Interest
rate risk arises from the possibility that changes in interest rates will affect the value of financial instruments. The Fund may be exposed
to risks associated with the effects of fluctuations in the prevailing levels of market interest rates on their financial position and
cash flows. The Fund may be exposed to interest rate risk as a result of mismatches or gaps in the amounts of assets and liabilities that
mature or reprice in a given period.
Foreign Currency Risk: The
Fund may invest a portion of its assets in non-U.S. currencies, or in instruments denominated in non-U.S. currencies, the prices of which
are determined with reference to currencies other than the U.S. Dollar. The Fund, however, values its securities and other assets in U.S.
Dollars. The Fund generally seeks to hedge its foreign currency exposure. To the extent the Fund’s investments in foreign currency
exposure are not hedged, the value of the Fund’s assets will fluctuate with U.S. Dollar exchange rates as well as the price changes
of the Fund’s investments in the various local markets and currencies.
CDO and CLO Risk: The Fund may invest in CDOs
and/or CLOs which are subject to the following risks: (i) distributions from collateral securities will not be adequate to make interest
or other payments; (ii) the quality of the collateral may decline in value or default; (iii) CDOs and/or CLOs typically will have no significant
underlying assets other than their underlying debt obligations or loans and payments on the CDOs and/or CLOs are and will be payable solely
from the cash flows from such debt obligations and/or loans; (iv) CDOs and/or CLOs are typically highly levered, and therefore the CDO
and/or CLO interests that the Fund may invest in are subject to a higher risk of total loss; (v) investments in CDOs and/or CLOs may be
riskier and less transparent to the Fund and its shareholders than direct investments in the underlying companies; (vi) the potential
for interruption and deferral of cash flow to Fund investments in the equity and junior debt tranches of CDOs and/or CLOs; (vii) interests
in CDOs and/or CLOs may be illiquid; (viii) investments in foreign CDOs and/or CLOs may involve significant risks in addition to the risks
inherent in U.S. CDOs and/or CLOs; (ix) the Fund may invest with collateral managers that have no or limited performance or operating
history; (x) the inability of a CDO or CLO collateral manager to reinvest the proceeds of any prepayments may adversely affect the Fund;
(xi) the loans underlying the CDOs and/or CLOs may be sold and replaced resulting in a loss to the Fund; (xii) the Fund may not have direct
rights against the underlying borrowers or obligors comprising the CDOs and/or CLOs’ investments or the entities that sponsored
the CDOs and/or CLOs; and (xiii) investments in junior tranches of CDOs and/or CLOs will likely be subordinate to the other debt tranches
of such CDOs and/or CLOs, and are subject to a higher degree of risk of total loss.
Commercial Mortgage-Backed Securities (“CMBS”)
and Residential Mortgage-Backed Securities (“RMBS”) Risk: CMBS and RMBS are mortgage-backed
securities that may be secured by interests in a single commercial or residential mortgage loan or a pool of mortgage loans secured by
commercial or residential property. CMBS and RMBS may be senior, subordinate, interest-only, principal-only, investment-grade, non-investment
grade or unrated. The Fund may acquire CMBS and RMBS from private originators as well as from other mortgage loan investors, including
savings and loan associations, mortgage bankers, commercial banks, finance companies and investment banks. The credit quality of any CMBS
and RMBS issue depends primarily on the credit quality of the underlying mortgage loans. At any one time, a portfolio of mortgage-backed
securities may be backed by commercial or residential mortgage loans with disproportionately large aggregate principal amounts secured
by properties in only a few states or regions. As a result, the commercial or residential mortgage loans may be more susceptible to geographic
risks relating to such areas, such as adverse economic conditions, adverse events affecting industries located in such areas and natural
hazards affecting such areas, than would be the case for a pool of mortgage loans having more diverse property locations.
NOTE 11. TAX BASIS INFORMATION
Distributions are determined in accordance with federal
income tax regulations, which differ from GAAP, and, therefore, may differ significantly in amount or character from net investment income
and realized gains for financial reporting purposes. The amounts and characteristics of tax basis distributions and composition of distributable
earnings/ (accumulated losses) are finalized at the Fund’s fiscal year-end.
For the year ended October 31, 2023, the following
reclassifications, which had no impact on results of operations or net assets, were recorded to reflect tax character:
| Decrease Paid-in Capital | Increase Total Distributable Earnings |
| $ (16,664) | $16,664 |
The reclassifications were primarily related to non-deductible offering
costs
| 1WS Credit Income Fund | Notes to Consolidated Financial Statements |
| October 31, 2023 |
As of October 31, 2023, the components of accumulated earnings/(deficit)
on a tax basis were as follows:
| Undistributed ordinary income | $ | 2,266,538 | ||
| Accumulated capital losses | (2,899,242 | ) | ||
| Unrealized appreciation/(depreciation) | (4,943,779 | ) | ||
| Other Cumulative effect of timing differences | (37,628 | ) | ||
| Total | $ | (5,614,111 | ) |
The amount of net unrealized appreciation/(depreciation)
and the cost of investment securities for tax purposes, including short-term securities at October 31, 2023, were as follows:
| Cost of investments for income tax purposes | $ | 219,222,803 | ||
| Gross appreciation (excess of value over tax cost) | $ | 8,559,721 | ||
| Gross depreciation (excess of tax cost over value) | (14,959,115 | ) | ||
| Net appreciation of foreign currency | 1,455,615 | |||
| Net unrealized appreciation/(depreciation) | $ | (4,943,779 | ) |
Capital Losses: Under
current law, capital losses maintain their character as short-term or long-term and are carried forward to the next tax year without expiration.
As of the current fiscal year end, the following amounts are available as carry forwards to the next tax year:
| Short Term Loss Carry Forward | Long Term Loss Carry Forward |
| $ – | $ 2,899,242 |
The tax character of distributions paid for the fiscal years ended October
31, 2023 and October 31, 2022 were as follows:
| 2023 | ||||
| Distributions Paid From: | ||||
| Ordinary Income | $ | 7,745,316 | ||
| Long-Term Capital Gain | 5,993,166 | |||
| Total | $ | 13,738,482 | ||
| 2022 | ||||
| Distributions Paid From: | ||||
| Ordinary Income | $ | 10,560,948 | ||
| Long-Term Capital Gain | 728,245 | |||
| Total | $ | 11,289,193 | ||
NOTE 12. SUBSEQUENT EVENTS
In preparing these consolidated financial statements,
the Fund’s management has evaluated events and transactions through the date the consolidated financial statements were issued.
On October 24, 2023 the Fund changed its quarterly
dividend rate to $0.40 per share per quarter for the Class I and Class A-2 shares. On December 28, 2023 the Fund paid a dividend of $0.40
per share for Class I and Class A-2 investors.
The Fund notified shareholders of a quarterly repurchase
offer on December 21, 2023. The Fund intends to complete the quarterly repurchase offer on January 12, 2024.
Management has determined that there were no other subsequent events requiring
disclosure.
| Annual Report | October 31, 2023 | 37 |
| 1WS Credit Income Fund | Report of Independent Registered Public Accounting Firm |
To the Shareholders and the Board of Trustees of 1WS Credit Income Fund:
Opinion on the Consolidated Financial Statements and Consolidated Financial
Highlights
We have audited the accompanying consolidated statement
of assets and liabilities of 1WS Credit Income Fund (the “Fund”), including the consolidated schedule of investments, as of
October 31, 2023, the related consolidated statements of operations and cash flows for the year then ended, the consolidated statements
of changes in net assets for each of the two years in the period then ended, the consolidated financial highlights for the periods presented,
and the related notes. In our opinion, the consolidated financial statements and consolidated financial highlights present fairly, in
all material respects, the consolidated financial position of the Fund as of October 31, 2023, and the results of their operations and
their cash flows for the year then ended, the changes in their net assets for each of the two years in the period then ended, and the
consolidated financial highlights for the periods presented in conformity with accounting principles generally accepted in the United
States of America.
Basis for Opinion
These consolidated financial statements and consolidated
financial highlights are the responsibility of the Fund’s management. Our responsibility is to express an opinion on the Fund’s
consolidated financial statements and consolidated financial highlights based on our audits. We are a public accounting firm registered
with the Public Company Accounting Oversight Board (United States) (PCAOB) and are required to be independent with respect to the Fund
in accordance with the U.S. federal securities laws and the applicable rules and regulations of the Securities and Exchange Commission
and the PCAOB.
We conducted our audits in accordance with the standards
of the PCAOB. Those standards require that we plan and perform the audit to obtain reasonable assurance about whether the consolidated
financial statements and consolidated financial highlights are free of material misstatement, whether due to error or fraud. The Fund
is not required to have, nor were we engaged to perform, an audit of its internal control over financial reporting. As part of our audits
we are required to obtain an understanding of internal control over financial reporting but not for the purpose of expressing an opinion
on the effectiveness of the Fund’s internal control over financial reporting. Accordingly, we express no such opinion.
Our audits included performing procedures to assess
the risks of material misstatement of the consolidated financial statements and consolidated financial highlights, whether due to error
or fraud, and performing procedures that respond to those risks. Such procedures included examining, on a test basis, evidence regarding
the amounts and disclosures in the consolidated financial statements and consolidated financial highlights. Our audits also included evaluating
the accounting principles used and significant estimates made by management, as well as evaluating the overall presentation of the consolidated
financial statements and consolidated financial highlights. Our procedures included confirmation of securities owned as of October 31,
2023, by correspondence with the custodian and brokers; when replies were not received from brokers, we performed other auditing procedures.
We believe that our audits provide a reasonable basis for our opinion.
DELOITTE & TOUCHE LLP
New York, New York
December 29, 2023
We have served as the auditor of 1WS Credit Income Fund since 2018.
| 1WS Credit Income Fund | Approval of Investment Advisory Agreement |
| October 31, 2023 |
At a meeting held on October 17, 2023, the Board of
Trustees (the “Board”) of 1WS Credit Income Fund, a Delaware statutory trust (the “Fund”), considered and approved
the continuation of the investment advisory agreement (the “Advisory Agreement”) between the Fund and 1WS Capital Advisors,
LLC, a Delaware limited liability company (the “Adviser”), for an additional one-year term. Also, by a unanimous vote, the
members of the Board (the “Trustees”) who are not “interested persons,” as defined by the Investment Company Act
of 1940 (the “1940 Act”), of the Fund (the “Independent Trustees”), separately voted to approve the Advisory Agreement.
In considering whether to approve the Advisory Agreement,
the Board reviewed various materials from the Adviser, which included: (i) information concerning the services provided to the Fund by
the Adviser; (ii) the investment performance of the Fund and Adviser; (iii) the fees and expenses of the Fund; (iv) information on the
profitability of the Adviser and its affiliates; and (v) other potential benefits to the Adviser from its relationship with the Fund.
In particular, the Board considered the following:
(a) The Nature, Extent and Quality of Services Provided by the Adviser
The Trustees reviewed various presentations the Adviser
provided to the Board regarding services provided to the Fund. The Trustees noted the importance of the Adviser having adequate resources
and, in this regard, noted One William Street Capital Management, L.P.’s, the sole managing member of the Adviser (“OWS”),
assets under management, positive earnings and sound capital position. The Trustees also took into account OWS’s representation,
as the sole managing member of the Adviser, that its current financial condition enables the Adviser to provide quality services to the
Fund. In connection with the broad scope of investment advisory services provided to the Fund, the Board discussed, in detail, with representatives
of the Adviser, the management of the Fund’s investments in accordance with the Fund’s stated investment objective and policies.
In this regard, the Board also considered the experience of the individuals responsible for the management and operation of the Fund’s
assets in managing funds and other alternative investment vehicles. The Board noted that the Adviser provides, at its own expense, facilities
necessary for the operation of the Fund and it makes certain of its personnel available to serve as the senior officers of the Fund, including
the Chief Executive Officer and the Chief Financial Officer. The Board found it was reasonable to expect that the Fund would continue
to receive the services required from the Adviser under the Advisory Agreement and that these services would be of high quality.
(b) Investment Performance of the Fund and Adviser
In connection with the evaluation of the services
provided by the Adviser, the Trustees reviewed the performance of the Fund. The Trustees observed that the Fund had experienced outperformance
versus the Fund’s benchmarks over the 3-month period, the year-to-date period and the period since inception.
(c) Cost of the Services Provided and Profits Realized by the Adviser
from its Relationship with the Fund
The Trustees reviewed the cost of services provided
by the Adviser and the fees paid under the Advisory Agreement. The Trustees considered that under the Advisory Agreement the Fund pays
the Adviser a fixed management fee of 1.50% of gross assets per annum, and that, for the one-year period beginning on March 1, 2023, the
Adviser has voluntarily agreed to reduce the management fee to 1.25% of the Fund’s daily gross assets. The Trustees also considered
information showing a comparison of the advisory fees compared with fees of other similar 1940 Act-registered products, as well as the
fees of similar funds managed by the Adviser (or its affiliates). The Board noted that the fees and expenses paid under the Advisory Agreement
were generally in line with those of other similar closed-end funds, and comparable to those charged by the Adviser to comparable accounts
which the Adviser (or its affiliates) manages. It was noted that, unlike other funds managed by the Adviser (or its affiliates), the Fund
is not subject to a performance or incentive fee. The Trustees observed that the Fund has in place an agreement with the Adviser under
which the Fund benefits from a 50 basis point expense limitation/cap on non-management gross assets. Based on its review, the Board concluded
that the level of the management fee for the Fund was fair and reasonable in light of the extent and quality of services provided to the
Fund.
In reaching this conclusion, the Trustees also considered
the profitability of the Adviser and its affiliates from the relationship with the Fund as well as other factors discussed below. The
Trustees observed the lack of meaningful profitability from the Fund during the period, given the relatively small asset size of the Fund
and the effect of the expense cap.
(d) Other Benefits
The Trustees then considered the direct and indirect
benefits to the Adviser and its affiliates from its relationship with the Fund, including the fees paid pursuant to the Advisory Agreement.
The Board concluded that the Fund benefits from those services and that the benefits to the Adviser derived from these relationships seemed
fair and reasonable.
(e) Economies of Scale
The Trustees then noted that economies of scale may
be realized when a fund’s assets increase significantly. The Trustees observed that because the Fund has not yet reached meaningful
asset levels, the Trustees did not consider specific information concerning the extent to which economies of scale would be realized as
the Fund grows and whether fee levels would reflect such economies of scale, if any.
| Annual Report | October 31, 2023 | 39 |
| 1WS Credit Income Fund | Approval of Investment Advisory Agreement |
| October 31, 2023 |
Conclusion
Based on all of the foregoing, and such other matters
as were deemed relevant, the Board found the fee structure under the Advisory Agreement to be fair and reasonable in light of the services
provided by the Adviser. No single factor was determinative to the decision of the Board. Based on this determination, all of the Trustees,
including all of the Independent Trustees, approved the continuation of the Advisory Agreement for an additional one-year term.
| 1WS Credit Income Fund | Additional Information |
| October 31, 2023 (Unaudited) |
Portfolio Information. The
Fund files its complete schedule of portfolio holdings with the Securities and Exchange Commission (the “SEC”) for the first
and third quarters of each fiscal year on Form N-PORT. The Fund’s Forms N-PORT will be available on the Fund’s website located
at https://www.1wscapital.com or on the SEC’s website at https://www.sec.gov.
Proxy Information. The
policies and procedures used to determine how to vote proxies relating to securities held by the Fund are available without charge, upon
request, by calling 1-833-834-4923, on the Fund’s website located at https://www.1wscapital.com, and on the SEC’s website
at https://www.sec.gov.
Information regarding how the Fund voted proxies relating
to portfolio securities during the most recent twelve-month period ended June 30 is available on Form N-PX by August 31 of each year without
charge, upon request, by calling 1-833-834-4923, on the Fund’s website located at www.1wscapital.com, and on the SEC’s website
at https://www.sec.gov.
| Annual Report | October 31, 2023 | 41 |
| 1WS Credit Income Fund | Trustees and Officers |
| October 31, 2023 |
Information About Each Board Member’s Experience,
Qualifications, Attributes or Skills. Board members of the Fund, together with information as to their positions with the Fund, principal
occupations and other board memberships, are shown below. Unless otherwise noted, each Trustee has held each principal occupation and
board membership indicated for at least the past five years. Each Trustee’s mailing address is c/o 1WS Credit Income Fund, 299 Park
Avenue, 25th Floor, New York, New York 10171.
INDEPENDENT TRUSTEES
| Name and Year of Birth | Position(s) Held and Length of Time Served(1) | Principal Occupation(s) During the Past 5 Years | Number of Portfolios in Fund Complex Overseen by Trustee(2) | Other Directorships During Past 5 Years |
|
Michael M. Knetter
Year of Birth: 1960 |
Trustee (since inception) | President and Chief Executive Officer, University of Wisconsin Foundation, since October 2010; formerly, Dean, School of Business, University of Wisconsin − Madison; formerly, Professor of International Economics and Associate Dean, Amos Tuck School of Business -Dartmouth College, 1998 to 2002. | None(3) | Trustee, Neuberger Berman Mutual Funds (2007 – present); Board Member, American Family Insurance (a mutual company, not publicly traded), since March 2009; formerly, Trustee, Northwestern Mutual Series Fund, Inc., 2007 to 2011; formerly, Director, Wausau Paper, 2005 to 2011; formerly, Director, Great Wolf Resorts, 2004 to 2009. |
|
George W. Morriss
Year of Birth: 1947 |
Trustee (since inception) | Adjunct Professor, Columbia University School of International and Public Affairs, 2012 – 2018; formerly, Executive Vice President and Chief Financial Officer, People’s United Bank (currently known as M&T Bank), Connecticut (a financial services company), 1991 to 2001. | None(3) | Trustee, Neuberger Berman Mutual Funds (chair of closed-end fund committee; vice-chair, contract review committee; chair of audit committee from 2010 to 2017; member of executive committee and investment performance committee) (February 2007 – present); trustee and chairman of the board, Thrivent Church Loan and Income Fund (September 2018 – July 2023); formerly, Trustee, Steben Alternative Investment Funds, Steben Select Multi-Strategy Fund, and Steben Select Multi-Strategy Master Fund, 2013 to 2017; formerly, Treasurer, National Association of Corporate Directors, Connecticut Chapter, 2011 to 2015; formerly, Manager, Larch Lane Multi-Strategy Fund complex (which consisted of three funds), 2006 to 2011; formerly, Member, NASDAQ Issuers’ Affairs Committee, 1995 to 2003. |
| 1WS Credit Income Fund | Trustees and Officers |
| October 31, 2023 |
INTERESTED TRUSTEES
| Name and Year of Birth | Position(s) Held and Length of Time Served(1) | Principal Occupation(s) During the Past 5 Years | Number of Portfolios in Fund Complex Overseen by Trustee(2) | Other Directorships During Past 5 Years |
|
Kurt A. Locher(4)
Year of Birth: 1966 |
Trustee and Chief Executive Officer (since inception) | Chief Operating Officer of One William Street Capital Management, L.P. (“OWS”), the managing member of 1WS Capital Advisors, LLC (the “Adviser”). | None(3) | Director of One William Street Capital Offshore Fund, Ltd. and other affiliated private funds of OWS. |
| OFFICERS OF THE FUND WHO ARE NOT TRUSTEES | ||
| Name and Year of Birth | Position(s) Held and Length of Time Served(1) | Principal Occupation(s) During the Past 5 Years |
|
Stephanie Dolan
Year of Birth: 1963 |
Chief Financial Officer and Principal Accounting Officer (since inception) | Chief Financial Officer/Controller of OWS, the managing member of the Adviser. |
|
Ivana Kovacic
Year of Birth: 1977 |
Chief Compliance and AML Officer (since May 2022 and June 2022, respectively) | VP, Fund CCO of SS&C ALPS, Sr. Compliance Analyst of Jennison Assoc., both affiliates of the Fund. |
| (1) | Each Trustee serves until resignation or removal from the Board. |
| (2) | Fund Complex means any two or more registered investment companies that: (i) share the same investment adviser or principal underwriter; and (ii) hold themselves out to investors as related companies for purposes of investment and investor services. Currently, the Fund is not part of any “Fund Complex.” |
| (4) | Mr. Locher is an “interested person” of the Trust, as defined in Section 2(a)(19) of the 1940 Act, due to his position as an officer of the Adviser and an officer of OWS. |
| Annual Report | October 31, 2023 | 43 |
| 1WS Credit Income Fund | Privacy Policy |
Your privacy is very important to us. This Privacy
Notice sets forth the policies of 1WS Credit Income Fund (the “Fund”) with respect to non-public personal information of its
investors, prospective investors and former investors. These policies apply to all investors and may be changed at any time, provided
a notice of such change is given to you.
To the extent you provide us with personal information,
such as your address, social security number, assets and/or income information: (i) in a subscription agreement and related documents;
and (ii) in correspondence and conversations with the Fund’s representatives; and (iii) through transactions in the Fund, please
be advised that:
We do not disclose any of this personal information
about our investors, prospective investors or former investors to anyone, other than to our affiliates, such as our attorneys, auditors,
brokers, regulators and certain service providers, in such case, only as necessary to facilitate the acceptance of your investment and
management of the Fund and in accordance with applicable laws. It may be necessary, under anti-money laundering and similar laws, to disclose
information about the Fund’s investors in order to accept subscriptions from them. We will also release information about you if
you direct us to do so, if compelled to do so by law, or in connection with any government or self-regulatory organization request or
investigation.
We may also disclose information you provide to us
to third party institutions, such as prime brokers. If such a disclosure is made, the Fund will require such third parties to treat your
private information with confidentiality.
We seek to carefully safeguard your private information
and, to that end, restrict access to non-public personal information about you to those employees and other persons who need to know the
information to enable the Fund to provide services to you. We maintain physical, electronic and procedural safeguards to protect your
non-public personal information.

Item
2. Code of Ethics.
| (a) | As of the end of the period covered by this report, the registrant has adopted a code of ethics (Code of Ethics) that applies to the registrants principal executive officer, principal financial officer, principal accounting officer or controller, or persons performing similar functions, regardless of whether these individuals are employed by the registrant or a third party. |
| (c) | During the period covered by this report, there were no amendments to the Code of Ethics. |
| (d) | During the period covered by this report, the registrant did not grant any express or implicit waivers from any provisions of the Code of Ethics. |
| (f) | Attached as Exhibit 13(a)(1) is a copy of the registrants Code of Ethics. |
Item
3. Audit Committee Financial Expert.
The
Board of Trustees (Board) of the registrant has determined that the registrant has at least one Audit Committee Financial
Expert serving on its audit committee. The Board has designated George W. Morriss as the registrants Audit Committee Financial
Expert. Mr. Morriss is independent within the meaning of that term as defined in paragraph (a)(2) of Item 3 to Form N-CSR.
Item
4. Principal Accountant Fees and Services.
| (a) | Audit Fees: Audit fees billed for the registrant for the fiscal years ended October 31, 2023 and October 31, 2022 were $150,000 and $140,000, respectively. This amount represents aggregate fees billed by the registrants independent registered public accounting firm, (the Accountant) in connection with the annual audit of the registrants financial statements and for services normally provided by the Accountant in connection with the registrants statutory and regulatory filings for that fiscal year. |
| (b) | Audit-Related Fees: Audit-Related fees billed in the fiscal years ended October 31, 2023 and October 31, 2022 for assurance and related services by the Accountant that were reasonably related to the performance of the audit of the registrants financial statements that were not reported under paragraph (a) of this Item were $7,600 and $7,500, respectively. |
| (c) | Tax Fees: The tax fees billed for the fiscal years ended October 31, 2023 and October 31, 2022 were $19,950 and $14,400, respectively, for professional services rendered by the Accountant for tax compliance, tax advice, and tax planning. These services were for the completion of the 1WS Credit Income Funds (the Fund) federal and state income tax returns, excise tax returns, and assistance with distribution calculations. |
| (d) | All Other Fees: For the registrants fiscal years ended October 31, 2023 and October 31, 2022, the aggregate fees billed for products and services provided by the Accountant, other than the services reported in paragraphs (a) through (c) of this Item, were $0 and $0. |
| (e)(1) | Audit Committee Pre-Approval Policies and Procedures: All services to be performed by the registrants principal accountant must be pre-approved by the registrants audit committee. |
| (e)(2) | No services described in paragraphs (b) through (d) of this Item met the waiver requirements for preapproval pursuant to paragraph (c)(7)(i)(C) of Rule 2-01 of Regulation S-X. |
| (g) | No non-audit fees were billed by the Accountant for services rendered to the registrants investment adviser pursuant to paragraph (c)(7)(ii) of Rule 2-01 of Regulation S-X. |
Item 5. Audit Committee of Listed Registrants.
Item
6. Investments.
| (a) | The registrants Schedule of Investments as of the close of the reporting period is included in the Report to Stockholders filed under Item 1 of this Form N-CSR. |
Item
7. Disclosure of Proxy Voting Policies and Procedures for Closed-End Management Investment Companies.
Attached
as Exhibit 13(c) is a copy of the investment advisers proxy voting policies and procedures.
Item
8. Portfolio Managers of Closed-End Management Investment Companies.
| (a)(1) | David Sherr. As of the date of this filing, Mr. Sherr serves as the Portfolio Manager of the Fund and has served as the Funds Portfolio Manager since the Funds inception. Mr. Sherr founded One William Street Capital Management, L.P. (OWS), the managing partner of 1WS Capital Advisors, LLC, the Funds adviser (the Adviser). OWS commenced operations in 2008. Mr. Sherr has over 30 years of experience in the investing and origination businesses, fixed income markets, and managing global trading. Prior to founding OWS, Mr. Sherr was a Managing Director and Global Head of Securitized Products at Lehman Brothers. In that capacity, Mr. Sherr had senior management responsibilities in Fixed Income, Principal Investing and Lending and Investment Banking. Mr. Sherr graduated with a B.S. in Finance from Babson College. |
(a)(2)(ii)
As of October 31, 2023, Mr. Sherr was responsible for the management of the following types of accounts in addition to the Fund:
| Registered Investment Companies |
Other Pooled Investment Vehicles |
Other Accounts |
||||
Portfolio Manager |
Number of Accounts |
Total Assets (in millions) |
Number of Accounts |
Total Assets (in millions) |
Number of Accounts |
Total Assets (in millions) |
| David Sherr |
None | $0 | 71 | $5,820.65 | 12 | $411.94 |
| 1 | Six accounts invested in pooled investment vehicles of total market value $5,695 million are subject to a performance-based advisory fee. |
| 2 | One separately managed account of total market value of $412million is subject to a performance-based advisory fee. |
(2)(iv)
Potential Conflicts of Interest
The
Adviser (which includes its managing member, OWS, as applicable) and the Fund have adopted compliance policies and procedures that are
designed to avoid, mitigate, monitor and oversee areas that could present potential conflicts of interest. These potential conflicts
include:
Allocation
of Limited Time and Attention. A portfolio manager who is responsible for managing multiple client accounts may devote unequal time
and attention to the management of those accounts.
Allocation
of Opportunities. The Adviser will seek to allocate orders and investment opportunities among clients in a manner that it believes
is equitable and in the best interests of all of its clients.
Conflicts
of Interest Among Accounts. At times, the Adviser and/or its affiliates may determine that an investment opportunity may be appropriate
for only some clients (including the Fund), or may decide that certain clients should take differing positions with respect to a particular
security even though they share investment objectives. In these cases, the portfolio manager may place separate transactions for one
or more clients, which may affect the market price of the security or the execution of the transaction, or both, to the detriment or
benefit of one or more other clients.
Related
Business Opportunities. The Adviser or its affiliates may provide more services (such as recordkeeping) for some types of clients
than for others. In such cases, a portfolio manager may benefit, either directly or indirectly, by devoting disproportionate attention
to the management of clients that provide greater overall returns to the Adviser and its affiliates.
Variation
in Compensation. A conflict of interest may arise where the financial or other benefits available to a portfolio manager differ among
the accounts that he manages. If the structure of the Advisers management fee and/or a portfolio managers compensation
differs among clients (such as where certain clients pay higher management fees), a portfolio manager might be motivated to help certain
clients over others. A portfolio manager might be motivated to favor accounts in which he has an interest or in which the Adviser and/or
its affiliates have interests. Similarly, the desire to maintain or raise assets under management or to enhance a portfolio managers
performance record or to derive other rewards, financial or otherwise, could influence a portfolio manager to lend preferential treatment
to those accounts that could most significantly benefit a portfolio manager.
Investments
by Adviser or Related Entities. The Adviser or a related entity may make investments in Credit Investments for its own accounts.
(a)(3)
Compensation
OWS
(the “Managing Member”) is the managing member of the Adviser. The Portfolio Manager controls the Managing
Member and the Adviser and shares in the overall profitability of the Adviser and the Managing Member, which includes profits generated
from the Funds fees. The compensation of the Portfolio Manager is not based, other than in an indirect manner as part of the overall
profitability of the Adviser/Managing Member, upon the specific pre- or after-tax performance of client accounts that the Portfolio Manager
manages.
(a)(4)
Portfolio Manager Securities Ownership
As
of October 31, 2023, the Portfolio Manager beneficially owned over $1,000,000 of equity securities in the Fund.
(b)
Not applicable.
Item
9. Purchases of Equity Securities by Closed-End Management Investment Company and Affiliated Purchasers.
Not
applicable.
Item
10. Submission of Matters to a Vote of Security Holders.
None.
Item
11. Controls and Procedures.
| (a) | The registrants principal executive and principal financial officers, or persons performing similar functions, have concluded that the registrants disclosure controls and procedures (as defined in Rule 30a-3(c) under the Investment Company Act of 1940, as amended (the 1940 Act) (17 CFR 270.30a-3(c))) are effective, as of a date within 90 days of the filing date of the report that includes the disclosure required by this paragraph, based on their evaluation of these controls and procedures required by Rule 30a-3(b) under the 1940 Act (17 CFR 270.30a-3(b)) and Rules 13a-15(b) or 15d-15(b) under the Securities Exchange Act of 1934, as amended (17 CFR 240.13a-15(b) or 240.15d-15(b)). |
| (b) | There were no changes in the registrants internal control over financial reporting (as defined in Rule 30a-3(d) under the 1940 Act (17 CFR 270.30a-3(d)) that occurred during the period covered by this report that have materially affected or are reasonably likely to materially affect the registrants internal control over financial reporting. |
Item
12. Disclosure of Securities Lending Activities for Closed-End Management Investment Companies.
Not
applicable.
Item
13. Exhibits.
SIGNATURES
Pursuant
to the requirements of the Securities Exchange Act of 1934 and the Investment Company Act of 1940, the registrant has duly caused this
report to be signed on its behalf by the undersigned, thereunto duly authorized.
1WS
Credit Income Fund
| By: | /s/ Kurt A. Locher | |
| Kurt A. Locher, Chief Executive Officer |
||
| (Principal Executive Officer) |
||
| Date: | January 5, 2024 |
|
Pursuant
to the requirements of the Securities Exchange Act of 1934 and the Investment Company Act of 1940, this report has been signed below
by the following persons on behalf of the registrant and in the capacities and on the dates indicated.
| By: | /s/ Kurt A. Locher | |
| Kurt A. Locher, Chief Executive Officer |
||
| (Principal Executive Officer) |
||
| Date: | January 5, 2024 |
|
| By: | /s/ Stephanie Dolan | |
| Stephanie Dolan, Chief Financial Officer and |
||
| Principal Accounting Officer |
||
| Date: | January 5, 2024 |
|
ATTACHMENTS / EXHIBITS
fp0085978-1_ex99code.htm
fp0085978-1_ex99cert.htm
fp0085978-1_ex99906cert.htm
fp0085978-1_ex9913c.htm
[ad_2]
Source link