


[ad_1]
UNITED STATES
SECURITIES AND EXCHANGE COMMISSION
Washington, D.C. 20549
FORM N-CSR
Certified Shareholder Report of
Registered Management Investment Companies
Investment Company Act File Number: 811-03735
The New Economy Fund
(Exact Name of Registrant as Specified in Charter)
333 South Hope Street, 55th Floor
Los Angeles, California 90071
(Address of Principal Executive Offices)
Registrant’s telephone number, including area code:
(949) 975-5000
Date of fiscal year end: November 30
Date of reporting period: November 30, 2023
Gregory F. Niland
The New Economy Fund
5300 Robin Hood Road
Norfolk, Virginia 23513
(Name and Address of Agent for Service)
ITEM 1 – Reports to Stockholders
|
The New Economy Fund®
Annual report |

We believe in investing
in global companies
that will help shape
our future
The Securities and Exchange Commission has adopted new regulations
that will change the content and design of annual and semi-annual shareholder reports beginning in July 2024. Certain types of information,
including investment portfolio and financial statements, will not be included in the shareholder reports but will be available online,
delivered free of charge upon request, and filed on a semi-annual basis on Form N-CSR.
If you would like to receive shareholder reports and other communications
from the fund electronically, you may update your mailing preferences with your financial intermediary or enroll in e-delivery at capitalgroup.com
(for accounts held directly with the fund).
The New Economy Fund seeks long-term growth of capital.
This fund is one of more than 40 offered by Capital Group, home of
American Funds, one of the nation’s largest mutual fund families. For over 90 years, Capital Group has invested with a long-term
focus based on thorough research and attention to risk.
Fund results shown in this report, unless otherwise indicated, are
for Class F-2 shares. Class A share results are shown at net asset value unless otherwise indicated. If a sales charge (maximum 5.75%)
had been deducted from Class A shares, the results would have been lower. Results are for past periods and are not predictive of results
for future periods. Current and future results may be lower or higher than those shown. Prices and returns will vary, so investors may
lose money. Investing for short periods makes losses more likely. For current information and month-end results, visit capitalgroup.com.
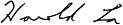
Here are the average annual total returns on a $1,000 investment for
periods ended December 31, 2023 (the most recent calendar quarter-end):
| 1 year | 5 years | 10 years | ||||||||||
| Class F-2 shares | 29.39 | % | 11.65 | % | 9.62 | % | ||||||
| Class A shares (reflecting 5.75% maximum sales charge) | 21.65 | 10.07 | 8.72 | |||||||||
For other share class results, visit capitalgroup.com and americanfundsretirement.com.
The total annual fund operating expense ratios are 0.52% for Class F-2
shares and 0.77% for Class A shares as of the prospectus dated February 1, 2024 (unaudited).
Investment results assume all distributions are reinvested and reflect
applicable fees and expenses. When applicable, results reflect fee waivers and/or expense reimbursements, without which they would have
been lower. Visit capitalgroup.com for more information.
Investing outside the United States involves risks, such as currency
fluctuations, periods of illiquidity and price volatility, as more fully described in the prospectus. These risks may be heightened in
connection with investments in developing countries. Small-company stocks entail additional risks, and they can fluctuate in price more
than larger company stocks. Refer to the fund prospectus and the Risk Factors section of this report for more information on these and
other risks associated with investing in the fund.
Investments are not FDIC-insured, nor are they deposits of or guaranteed
by a bank or any other entity, so they may lose value.
Contents
Fellow investors:
We are pleased to present this annual report for the 12 months ended
November 30, 2023.
Global equity markets rebounded over The New Economy Fund’s fiscal
year. Marked by optimism that inflation has peaked, the economy showed signs of stabilization as pressures eased. U.S. equities rallied
throughout the first half of the year before reversing some of those gains as the Federal Reserve adopted a “wait and see”
approach to further policy tightening.
For the fiscal year, the fund had a total return of 17.26% for its Class
F-2 shares with all dividends reinvested. This return exceeded the 12.01% return of its primary benchmark, the unmanaged MSCI ACWI (All
Country World Index), which measures equity market results based on more than 40 developed and emerging market country indexes. For the
10-year period ended November 30, 2023, The New Economy Fund had an average annual total return of 9.36%, which exceeded the 7.60% return
of the MSCI ACWI. We believe the 10-year and lifetime returns (refer to the table below) are important for investors to consider, as they
best reflect our long-term approach and philosophy.
Butterfly effect of higher interest rates
At this time last year, investors and market participants were focused
on rising recession fears. Those fears were magnified in early 2023 as aggressive rate hikes fueled three major U.S. bank failures, sparking
worries over the stability of the financial system. Liquidity concerns escalated internationally as the Swiss government brokered an acquisition
of Credit Suisse Group AG to UBS Group AG to prevent further contagion.
Results at a glance
For periods ended November 30, 2023, with all distributions reinvested
| Cumulative total returns |
Average annual total returns | |||||||||||||||
| 1 year | 5 years | 10 years | Lifetime1 | |||||||||||||
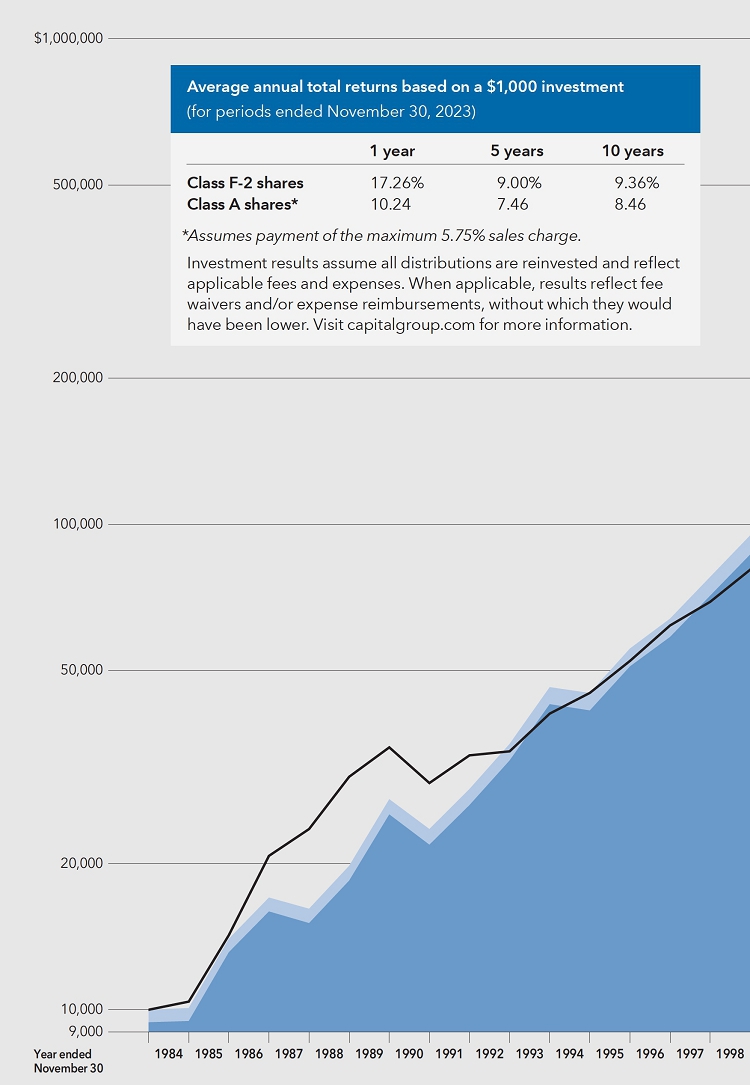
| The New Economy Fund (Class F-2 shares)2 | 17.26 | % | 9.00 | % | 9.36 | % | 11.18 | % | ||||||||
| The New Economy Fund (Class A shares) | 16.97 | 8.74 | 9.10 | 10.93 | ||||||||||||
| MSCI ACWI (All Country World Index)3,4 | 12.01 | 9.07 | 7.60 | 9.26 | ||||||||||||
Past results are not predictive of results in future periods.
| 1 | Lifetime returns are as of December 1, 1983, the inception date of Class A shares. |
| 2 | Class F-2 shares were first offered on August 1, 2008. Class F-2 share results prior to the date of first sale are hypothetical based on the results of the original share class of the fund without a sales charge, adjusted for typical estimated expenses. Visit capitalgroup.com for more information on specific expense adjustments and the actual dates of first sale. |
| 3 | From December 1, 1983, through December 31, 1987, the MSCI World Index was used because the MSCI ACWI did not exist. MSCI World Index results reflect dividends net of withholding taxes, and MSCI ACWI results reflect dividends gross of withholding taxes through December 31, 2000, and dividends net of withholding taxes thereafter. Source: MSCI. |
| 4 | Market indexes are unmanaged and, therefore, have no expenses. Investors cannot invest directly in an index. There have been periods when the fund has lagged the index. |
| The New Economy Fund | 1 |
While inflation has come down in the United States, the Fed remains
watchful as some elements of inflation — such as housing costs — remain persistently high. Core inflation, which excludes
volatile components such as energy and food, continues to be a concern. Despite the uncertainty, the U.S. economy has been resilient,
with real gross domestic product (GDP) managing to increase at a 5.2% annual rate in the third quarter.
Overseas, China’s strict “zero-COVID” measures were
lifted in late 2022, providing a tailwind to the global economy despite ongoing weakness in its property sector. Climate change continues
to be a focus for the European Union, with a target to reduce and phase out CO2-emitting cars by 2035. These measures will
have varied impacts, affecting not only businesses globally but also fiscal policy around how money is transmitted.
Cyclical stocks made a comeback
With economic growth proving resilient in the face of higher interest
rates and rising hopes for an easing of monetary policy, the MSCI ACWI rebounded quickly in November to close out the year.
U.S. large-cap stocks in the Russell 1000 Index5 outpaced
the small-cap stocks in the Russell 2000 Index6 by 16.14% for the fiscal year period. Growth stocks led value stocks (Russell
1000 Growth7 vs. Russell 1000 Value8) by 24.81% for the fiscal year, a stark reversal from the last reporting period.
And cyclical sectors in the MSCI USA Index9 led defensive sectors by 27.25% for the fiscal year.
Globally, growth stocks within the MSCI ACWI continued the trend, as
they grew nearly 21% for the fiscal year, leading the increase of the overall index by approximately 8.67%, while value stocks within
the index managed a modest return of 3.59%.
Within the MSCI ACWI, information technology (IT) and communication
services stocks mostly led the sectors, bolstered by the concentrated gains of the “Magnificent 7” — Apple, Microsoft,
Alphabet, Amazon, NVIDIA, Meta and Tesla. The extreme trends in artificial intelligence (AI) among these handful of companies have propped
up so much of the index, it would have declined or remained flat for the year to date without them.
Inside the fund
At the end of the reporting period, roughly 76% of the fund’s
equity assets were in companies domiciled in the United States — a 5% increase from last year — with the rest in other countries.
At the sector level, health care weighed on relative results as expectations
for pandemic-related revenues declined. Thermo Fisher Scientific fell 11.51% over the fiscal year as demand for COVID-19 testing waned.
The company was also negatively impacted by relatively higher interest rates and the rising cost of borrowing money, which in turn limits
the research and development budgets. Agilon Health fell by 39.52% for the fiscal year as it suffered from increased costs post-COVID
as consumers caught up on deferred health care services.
The portfolio’s largest holding is Microsoft, which appreciated
48.51% during the reporting period, highlighted by a 24% year-over-year increase in Microsoft Cloud revenue for the quarter ending in
September and significant announcements around a series of new AI-enhanced services. Microsoft demonstrated its commitment to generative
AI services by making a multi-billion dollar investment in OpenAI, maker of ChatGPT, in the beginning of 2023. More recently, it secured
a nonvoting observer seat on the nonprofit’s board.
The next largest holding is Broadcom, a global technology company that
designs, develops and supplies a wide range of semiconductor and infrastructure
| 5 | Russell 1000 Index is a market capitalization-weighted index that represents the top 1,000 stocks in the U.S. equity market by market capitalization. |
| 6 | Russell 2000 Index is a small-cap stock market index of the bottom 2,000 stocks in the Russell 3000 Index. The index is maintained by the FTSE Russell, a subsidiary of the London Stock Exchange Group. |
| 7 | Russell 1000 Growth Index is a market capitalization-weighted index that represents the large-cap growth segment of the U.S. equity market and includes stocks from the Russell 1000 Index that have higher price-to-book ratios and higher expected growth values. |
| 8 | Russell 1000 Value Index is a market capitalization-weighted index that represents the large-cap value segment of the U.S. equity market and includes stocks from the Russell 1000 Index that have lower price-to-book ratios and lower expected growth values. |
| 9 | MSCI USA Index is a free float-adjusted, market capitalization-weighted index that is designed to measure the U.S. portion of the world market. |
The indexes are unmanaged, and their results include reinvested dividends
and/or distributions but do not reflect the effect of sales charges, commissions, account fees, expenses or U.S. federal income taxes.
Past results are not predictive of results in future periods.
software solutions. Shares rose 68.00% for the fiscal year thanks to
a solid earnings report in October in which its AI-related revenues grew sharply in anticipation of the completion of its significant
acquisition of VMware. As the global leader in data center ethernet solutions, Broadcom has been benefiting from the significant increase
in AI-related computing infrastructure investments being made by cloud services providers.
Alphabet, the third-largest holding, posted gains of 31.23% and 32.01%
in its Class A and Class C shares, respectively. The company posted an 11% increase in revenue year over year as of September 30 due to
growth in Google Search, YouTube and cloud services. Alphabet continues to cement its role as a major contender in its pursuit to bring
generative AI to its consumers with products such as Google Gemini, Assistant with Bard, Duet AI, Google AI and many other applications.
A look ahead
Generative AI remains a key area of innovation. We are seeing tremendous
promise in its potential to increase productivity in a surprisingly wide range of activities — from software coding to drug discovery.
We believe it’s likely that applications will keep expanding as models grow in sophistication. We are enthusiastic about developments
such as Microsoft’s CoPilot, which embeds ChatGPT into familiar Office applications like Word and Excel. It also has the potential
to unlock further productivity gains and broaden access to professional software features to casual or untrained users. Alphabet is similarly
connecting Bard to Gmail and other applications. Development and innovation is happening rapidly in this space.
Additional areas of investment research focus for the fund’s management
team continue to be health care, renewable energy and fintech. We see significant potential in biotech given advances in genomics, molecular
biology and the application of AI. We are seeing an explosion of biologics and new therapeutic modalities and are finding interesting
investment opportunities across the value chain from equipment suppliers to providers of outsource services to pharmaceutical companies.
Similarly, we are seeing opportunities in the growth of value-based care in the U.S. This approach more holistically addresses patient
care, focusing on disease prevention and cost-effective treatment of chronic conditions.
We see exciting opportunities in renewable energy. Geopolitical concerns
are driving demand for alternative energy sources as a way to address environmental, social and governance (ESG) needs. The surge of green
energy investments from the U.S., Europe and United Kingdom look to incentivize businesses to invest in more sustainable approaches toward
combating climate change. We also see trends in digital banking as preferences switch toward conducting transactions online. The lower
costs of operation enable these savings to be passed on to the consumer, particularly in emerging markets. Embedded payment systems will
continue to become faster and easier to use.
Ultimately, we continue to be excited about the rapid acceleration of
deploying technology and driving productivity. Innovation remains unavoidable as we see businesses adapt to meet the changes and needs
of the consumer. As long-term investors focused on structural, secular trends, we believe that well-managed companies are poised to provide
the framework to improve standards of living, focus on climate change and work toward addressing humanities’ needs.
We thank you for your commitment to The New Economy Fund, and we look
forward to reporting to you again in six months.
Sincerely,

Mathews Cherian
Co-President
Harold H. La
Co-President
January 9, 2024
For current information about the fund, visit capitalgroup.com.
Past results are not predictive of results in future periods.
The value of a long-term perspective
Fund results shown are for Class F-2 shares and Class A shares.
Class A share results reflect deduction of the maximum sales charge of 5.75% on the $10,000 investment1; thus,
the net amount invested was $9,425.2 Results are for past periods and are not predictive of results for future
periods. Current and future results may be lower or higher than those shown. Prices and returns will vary, so investors may lose
money. Investing for short periods makes losses more likely. For current information and month-end results, visit capitalgroup.com.
Class F-2 shares were first offered on August 1, 2008. Class F-2
share results prior to the date of first sale are hypothetical based on the results of the original share class of the fund without a
sales charge, adjusted for typical estimated expenses. Visit capitalgroup.com for more information on specific expense adjustments and
the actual dates of first sale.
The results shown are before taxes on fund distributions and sale
of fund shares.
| 1 | As outlined in the prospectus, the sales charge is reduced for accounts (and aggregated investments) of $25,000 or more and is eliminated for purchases of $1 million or more. There is no sales charge on dividends or capital gain distributions that are reinvested in additional shares. |
| 2 | The maximum initial sales charge was 8.50% prior to July 1, 1988. |
| 3 | All results are calculated with dividends and capital gains reinvested. |
| 4 | From December 1, 1983, through December 31, 1987, the MSCI World Index was used because the MSCI ACWI did not exist. MSCI World Index results reflect dividends net of withholding taxes, and MSCI ACWI results reflect dividends gross of withholding taxes through December 31, 2000, and dividends net of withholding taxes thereafter. Source: MSCI. |
| 5 | The market index is unmanaged and, therefore, has no expenses. Investors cannot invest directly in an index. |
| 4 | The New Economy Fund |
How a hypothetical $10,000 investment has grown
This chart illustrates how a hypothetical $10,000 investment in The
New Economy Fund’s Class F-2 and Class A shares grew between December 1, 1983 — when the fund began operations — and
November 30, 2023, the end of its latest fiscal year.
Investment
portfolio November 30, 2023
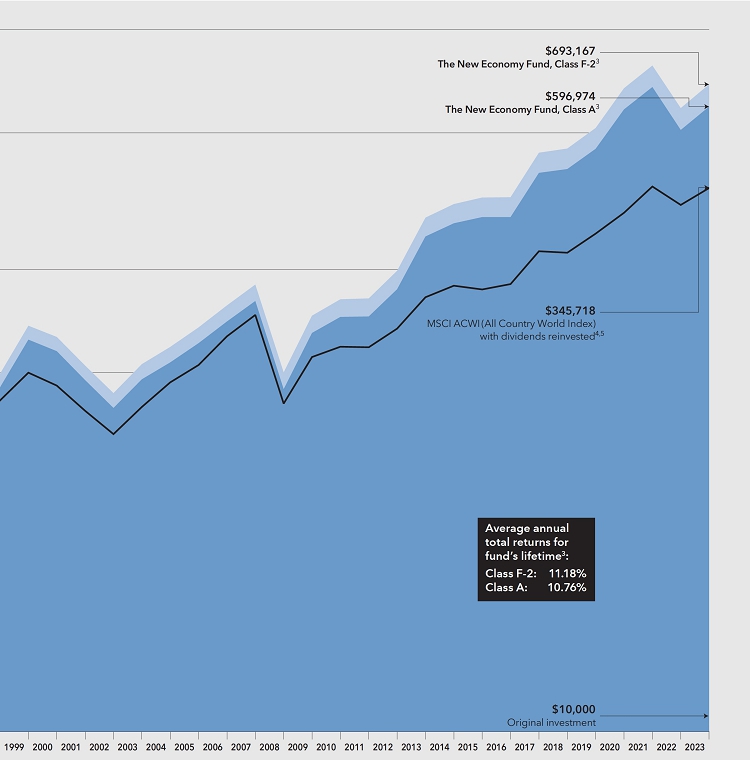
| Sector diversification | Percent of net assets |
| Country diversification by domicile | Percent of net assets |
|||
| United States | 76.19 | % | ||
| Eurozone* | 6.34 | |||
| Taiwan | 2.08 | |||
| India | 1.60 | |||
| South Korea | 1.50 | |||
| Denmark | 1.33 | |||
| Japan | 1.00 | |||
| United Kingdom | .92 | |||
| Canada | .83 | |||
| Other countries | 3.19 | |||
| Short-term securities & other assets less liabilities | 5.02 | |||
| * | Countries using the euro as a common currency; those represented in the fund’s portfolio are Belgium, Finland, France, Germany, Ireland, Italy, the Netherlands and Spain. |
| Common stocks 94.63% | Shares | Value (000) |
||||||
| Information technology 31.38% | ||||||||
| Microsoft Corp. | 5,092,211 | $ | 1,929,490 | |||||
| Broadcom, Inc. | 1,597,887 | 1,479,212 | ||||||
| Salesforce, Inc.1 | 1,818,132 | 457,987 | ||||||
| SK hynix, Inc. | 4,233,601 | 439,390 | ||||||
| Taiwan Semiconductor Manufacturing Co., Ltd. (ADR) | 3,242,839 | 315,561 | ||||||
| Taiwan Semiconductor Manufacturing Co., Ltd. | 6,284,000 | 116,065 | ||||||
| Micron Technology, Inc. | 5,306,694 | 403,946 | ||||||
| NVIDIA Corp. | 756,206 | 353,678 | ||||||
| Arista Networks, Inc.1 | 1,245,540 | 273,658 | ||||||
| Apple, Inc. | 1,361,814 | 258,677 | ||||||
| Motorola Solutions, Inc. | 664,894 | 214,674 | ||||||
| ServiceNow, Inc.1 | 282,736 | 193,883 | ||||||
| Palo Alto Networks, Inc.1 | 643,131 | 189,782 | ||||||
| Shopify, Inc., Class A, subordinate voting shares1 | 2,437,962 | 177,532 | ||||||
| Insight Enterprises, Inc.1 | 1,119,355 | 169,493 | ||||||
| Adobe, Inc.1 | 272,752 | 166,654 | ||||||
| Accenture PLC, Class A | 427,128 | 142,293 | ||||||
| ASML Holding NV | 200,633 | 136,056 | ||||||
| MongoDB, Inc., Class A1 | 272,750 | 113,393 | ||||||
| Smartsheet, Inc., Class A1 | 2,478,606 | 105,043 | ||||||
| Seagate Technology Holdings PLC | 1,320,387 | 104,443 | ||||||
| Applied Materials, Inc. | 683,931 | 102,439 | ||||||
| SAP SE | 625,497 | 99,051 | ||||||
| EPAM Systems, Inc.1 | 377,314 | 97,419 | ||||||
| Wolfspeed, Inc.1 | 2,495,057 | 91,968 | ||||||
| MediaTek, Inc. | 3,037,400 | 91,880 | ||||||
| Marvell Technology, Inc. | 1,580,588 | 88,086 | ||||||
| eMemory Technology, Inc. | 1,071,000 | 86,222 | ||||||
| Synopsys, Inc.1 | 129,879 | 70,554 | ||||||
| Globant SA1 | 314,300 | 69,397 | ||||||
| Sage Group PLC (The) | 3,743,040 | 53,421 | ||||||
| Renesas Electronics Corp.1 | 2,994,800 | 52,590 | ||||||
| Monday.com, Ltd.1,2 | 266,751 | 47,973 | ||||||
| NEC Corp. | 855,100 | 47,525 | ||||||
| DoubleVerify Holdings, Inc.1 | 1,416,274 | 47,020 | ||||||
| Cloudflare, Inc., Class A1 | 602,437 | 46,478 | ||||||
| Snowflake, Inc., Class A1 | 239,404 | 44,931 | ||||||
| Keyence Corp. | 93,400 | 39,909 | ||||||
| TE Connectivity, Ltd. | 295,035 | 38,650 | ||||||
| Datadog, Inc., Class A1 | 331,098 | 38,596 | ||||||
| ON Semiconductor Corp.1 | 495,000 | 35,308 | ||||||
| Constellation Software, Inc. | 14,025 | 32,943 | ||||||
| HubSpot, Inc.1 | 60,686 | 29,975 | ||||||
| RingCentral, Inc., Class A1 | 903,769 | 25,721 | ||||||
| Common stocks (continued) | Shares | Value (000) |
||||||
| Information technology (continued) | ||||||||
| Zeta Global Holdings Corp., Class A1 | 2,582,300 | $ | 21,097 | |||||
| Klaviyo, Inc., Class A1 | 677,100 | 20,062 | ||||||
| Autodesk, Inc.1 | 72,507 | 15,838 | ||||||
| OBIC Co., Ltd. | 98,700 | 15,109 | ||||||
| Qorvo, Inc.1 | 129,258 | 12,473 | ||||||
| Stripe, Inc., Class B1,3,4 | 63,586 | 1,408 | ||||||
| 9,204,953 | ||||||||
| Health care 19.86% | ||||||||
| UnitedHealth Group, Inc. | 1,467,828 | 811,665 | ||||||
| Eli Lilly and Co. | 941,313 | 556,354 | ||||||
| Thermo Fisher Scientific, Inc. | 1,106,348 | 548,483 | ||||||
| Novo Nordisk AS, Class B | 3,835,051 | 389,460 | ||||||
| Vertex Pharmaceuticals, Inc.1 | 907,272 | 321,909 | ||||||
| Molina Healthcare, Inc.1 | 830,448 | 303,579 | ||||||
| Alnylam Pharmaceuticals, Inc.1 | 1,462,930 | 246,138 | ||||||
| agilon health, Inc.1,2,5 | 22,210,517 | 235,876 | ||||||
| Abbott Laboratories | 2,161,050 | 225,376 | ||||||
| Stryker Corp. | 663,659 | 196,662 | ||||||
| Insulet Corp.1 | 914,356 | 172,896 | ||||||
| Catalent, Inc.1 | 3,920,766 | 152,322 | ||||||
| WuXi AppTec Co., Ltd., Class H2 | 10,609,752 | 124,280 | ||||||
| ICON PLC1 | 441,986 | 117,984 | ||||||
| Humana, Inc. | 242,782 | 117,715 | ||||||
| DexCom, Inc.1 | 870,776 | 100,592 | ||||||
| Exact Sciences Corp.1 | 1,420,000 | 90,880 | ||||||
| GE HealthCare Technologies, Inc. | 1,229,273 | 84,156 | ||||||
| WuXi Biologics (Cayman), Inc.1 | 14,780,000 | 82,308 | ||||||
| AbbVie, Inc. | 568,348 | 80,927 | ||||||
| Zoetis, Inc., Class A | 440,104 | 77,753 | ||||||
| Regeneron Pharmaceuticals, Inc.1 | 90,042 | 74,177 | ||||||
| Centene Corp.1 | 938,123 | 69,121 | ||||||
| Argenx SE (ADR)1 | 152,794 | 68,850 | ||||||
| iRhythm Technologies, Inc.1 | 798,053 | 68,058 | ||||||
| AstraZeneca PLC | 505,406 | 64,609 | ||||||
| Lonza Group AG | 154,799 | 59,820 | ||||||
| EssilorLuxottica SA | 299,812 | 57,150 | ||||||
| Bachem Holding AG | 692,289 | 51,386 | ||||||
| Gilead Sciences, Inc. | 576,416 | 44,153 | ||||||
| IQVIA Holdings, Inc.1 | 170,124 | 36,424 | ||||||
| Daiichi Sankyo Co., Ltd. | 1,349,345 | 36,405 | ||||||
| Illumina, Inc.1 | 315,590 | 32,174 | ||||||
| Revance Therapeutics, Inc.1,5 | 4,478,779 | 30,321 | ||||||
| Rede D’Or Sao Luiz SA | 5,111,400 | 27,623 | ||||||
| Align Technology, Inc.1 | 92,576 | 19,793 | ||||||
| BioMarin Pharmaceutical, Inc.1 | 183,694 | 16,731 | ||||||
| HOYA Corp. | 128,700 | 14,466 | ||||||
| Penumbra, Inc.1 | 64,203 | 14,259 | ||||||
| NovoCure, Ltd.1 | 321,175 | 3,941 | ||||||
| Sarepta Therapeutics, Inc.1 | 8,101 | 658 | ||||||
| 5,827,434 | ||||||||
| Financials 11.68% | ||||||||
| Mastercard, Inc., Class A | 1,213,238 | 502,074 | ||||||
| Visa, Inc., Class A | 1,161,473 | 298,127 | ||||||
| Fiserv, Inc.1 | 1,640,968 | 214,327 | ||||||
| KKR & Co., Inc. | 2,765,236 | 209,715 | ||||||
| Berkshire Hathaway, Inc., Class B1 | 575,902 | 207,325 | ||||||
| NU Holdings, Ltd. / Cayman Islands, Class A1 | 23,886,865 | 194,439 | ||||||
| RenaissanceRe Holdings, Ltd. | 819,435 | 175,654 | ||||||
| AIA Group, Ltd. | 17,154,000 | 148,014 | ||||||
| Kotak Mahindra Bank, Ltd. | 6,552,998 | 137,941 | ||||||
| HDFC Bank, Ltd. (ADR) | 1,235,846 | 74,200 | ||||||
| HDFC Bank, Ltd. | 3,016,422 | 56,383 | ||||||
| Affirm Holdings, Inc., Class A1 | 2,612,339 | 89,891 | ||||||
| Adyen NV1 | 71,097 | 82,884 | ||||||
| Marsh & McLennan Companies, Inc. | 378,316 | 75,444 | ||||||
| Tradeweb Markets, Inc., Class A | 766,089 | 74,234 | ||||||
| Common stocks (continued) | Shares | Value (000) |
||||||
| Financials (continued) | ||||||||
| Block, Inc., Class A1 | 1,155,905 | $ | 73,319 | |||||
| Discover Financial Services | 765,002 | 71,145 | ||||||
| Arthur J. Gallagher & Co. | 245,633 | 61,163 | ||||||
| CME Group, Inc., Class A | 266,102 | 58,106 | ||||||
| Bajaj Finserv, Ltd. | 2,787,500 | 55,938 | ||||||
| Intercontinental Exchange, Inc. | 490,244 | 55,809 | ||||||
| Aon PLC, Class A | 169,342 | 55,627 | ||||||
| Blackstone, Inc. | 479,552 | 53,887 | ||||||
| Star Health & Allied Insurance Co., Ltd.1 | 5,796,777 | 40,177 | ||||||
| Arch Capital Group, Ltd.1 | 477,816 | 39,988 | ||||||
| ICICI Bank, Ltd. | 3,500,000 | 39,239 | ||||||
| MSCI, Inc. | 72,632 | 37,830 | ||||||
| Corebridge Financial, Inc. | 1,698,134 | 35,712 | ||||||
| JPMorgan Chase & Co. | 223,879 | 34,943 | ||||||
| Brookfield Corp., Class A | 972,800 | 34,311 | ||||||
| LPL Financial Holdings, Inc. | 144,465 | 32,115 | ||||||
| Morgan Stanley | 394,209 | 31,277 | ||||||
| Janus Henderson Group PLC | 1,049,020 | 27,474 | ||||||
| Jio Financial Services, Ltd.1 | 8,881,000 | 24,430 | ||||||
| GMO Payment Gateway, Inc. | 389,300 | 22,863 | ||||||
| 3,426,005 | ||||||||
| Consumer discretionary 9.43% | ||||||||
| Amazon.com, Inc.1 | 4,673,353 | 682,730 | ||||||
| MercadoLibre, Inc.1 | 299,509 | 485,342 | ||||||
| LVMH Moët Hennessy-Louis Vuitton SE | 238,253 | 182,237 | ||||||
| Chipotle Mexican Grill, Inc.1 | 80,525 | 177,336 | ||||||
| Flutter Entertainment PLC1 | 905,778 | 141,236 | ||||||
| Evolution AB | 1,361,628 | 140,960 | ||||||
| Airbnb, Inc., Class A1 | 1,056,330 | 133,457 | ||||||
| Home Depot, Inc. | 424,251 | 132,998 | ||||||
| Floor & Decor Holdings, Inc., Class A1 | 1,349,567 | 123,769 | ||||||
| Hilton Worldwide Holdings, Inc. | 720,686 | 120,729 | ||||||
| Amadeus IT Group SA, Class A, non-registered shares | 1,158,751 | 79,235 | ||||||
| Booking Holdings, Inc.1 | 20,980 | 65,577 | ||||||
| Tractor Supply Co. | 265,952 | 53,991 | ||||||
| O’Reilly Automotive, Inc.1 | 54,149 | 53,195 | ||||||
| YUM! Brands, Inc. | 328,743 | 41,274 | ||||||
| adidas AG | 177,164 | 37,053 | ||||||
| Norwegian Cruise Line Holdings, Ltd.1 | 2,012,426 | 30,730 | ||||||
| Light & Wonder, Inc.1 | 237,667 | 21,015 | ||||||
| Aptiv PLC1 | 247,656 | 20,516 | ||||||
| DoorDash, Inc., Class A1 | 184,782 | 17,366 | ||||||
| Sony Group Corp. | 165,100 | 14,276 | ||||||
| International Game Technology PLC | 467,873 | 12,506 | ||||||
| 2,767,528 | ||||||||
| Industrials 8.55% | ||||||||
| Ceridian HCM Holding, Inc.1 | 5,334,198 | 367,526 | ||||||
| TransDigm Group, Inc. | 335,848 | 323,378 | ||||||
| Airbus SE, non-registered shares | 1,672,227 | 247,914 | ||||||
| Safran SA | 1,164,627 | 204,124 | ||||||
| L3Harris Technologies, Inc. | 782,473 | 149,304 | ||||||
| General Electric Co. | 1,178,818 | 143,580 | ||||||
| Copart, Inc.1 | 2,219,888 | 111,483 | ||||||
| Ryanair Holdings PLC (ADR)1 | 919,542 | 108,708 | ||||||
| RTX Corp. | 1,185,840 | 96,622 | ||||||
| Quanta Services, Inc. | 501,900 | 94,513 | ||||||
| Carrier Global Corp. | 1,670,901 | 86,820 | ||||||
| United Rentals, Inc. | 159,300 | 75,830 | ||||||
| Siemens AG | 338,884 | 56,807 | ||||||
| Recruit Holdings Co., Ltd. | 1,377,600 | 51,151 | ||||||
| Boeing Co.1 | 220,381 | 51,047 | ||||||
| CSX Corp. | 1,542,174 | 49,812 | ||||||
| Weir Group PLC (The) | 1,941,474 | 45,907 | ||||||
| NIBE Industrier AB, Class B | 6,674,243 | 39,370 | ||||||
| Melrose Industries PLC | 5,727,894 | 37,501 | ||||||
| XPO, Inc.1 | 378,347 | 32,644 | ||||||
| Common stocks (continued) | Shares | Value (000) |
||||||
| Industrials (continued) | ||||||||
| Rentokil Initial PLC | 5,777,105 | $ | 31,266 | |||||
| Union Pacific Corp. | 132,000 | 29,736 | ||||||
| Old Dominion Freight Line, Inc. | 68,634 | 26,703 | ||||||
| Saia, Inc.1 | 57,939 | 22,619 | ||||||
| Shenzhen Inovance Technology Co., Ltd., Class A | 1,853,527 | 17,158 | ||||||
| Grab Holdings, Ltd., Class A1 | 1,998,134 | 6,074 | ||||||
| 2,507,597 | ||||||||
| Communication services 6.20% | ||||||||
| Alphabet, Inc., Class A1 | 3,399,188 | 450,495 | ||||||
| Alphabet, Inc., Class C1 | 2,786,485 | 373,166 | ||||||
| Meta Platforms, Inc., Class A1 | 1,466,892 | 479,894 | ||||||
| Netflix, Inc.1 | 301,336 | 142,824 | ||||||
| T-Mobile US, Inc. | 452,836 | 68,129 | ||||||
| Charter Communications, Inc., Class A1 | 129,879 | 51,969 | ||||||
| New York Times Co., Class A | 1,015,052 | 47,697 | ||||||
| Warner Music Group Corp., Class A | 1,399,254 | 46,329 | ||||||
| Epic Games, Inc.1,3,4 | 84,438 | 45,326 | ||||||
| Comcast Corp., Class A | 922,522 | 38,644 | ||||||
| Take-Two Interactive Software, Inc.1 | 243,453 | 38,514 | ||||||
| Live Nation Entertainment, Inc.1 | 433,144 | 36,479 | ||||||
| 1,819,466 | ||||||||
| Energy 3.26% | ||||||||
| Halliburton Co. | 3,899,087 | 144,383 | ||||||
| Transocean, Ltd.1 | 18,706,090 | 118,971 | ||||||
| Noble Corp. PLC, Class A | 2,522,850 | 116,404 | ||||||
| Viper Energy, Inc., Class A | 3,673,000 | 113,202 | ||||||
| Neste OYJ | 2,169,337 | 82,363 | ||||||
| Schlumberger NV | 1,574,843 | 81,955 | ||||||
| TechnipFMC PLC | 3,362,680 | 69,675 | ||||||
| Weatherford International1 | 733,875 | 66,555 | ||||||
| Baker Hughes Co., Class A | 1,916,474 | 64,681 | ||||||
| Gaztransport & Technigaz SA | 421,006 | 56,641 | ||||||
| Reliance Industries, Ltd. | 1,402,547 | 39,985 | ||||||
| 954,815 | ||||||||
| Consumer staples 1.90% | ||||||||
| Performance Food Group Co.1 | 1,606,500 | 104,503 | ||||||
| Dollar Tree Stores, Inc.1 | 751,557 | 92,885 | ||||||
| Dollar General Corp. | 613,606 | 80,456 | ||||||
| Kroger Co. | 1,475,000 | 65,298 | ||||||
| Costco Wholesale Corp. | 82,323 | 48,796 | ||||||
| Philip Morris International, Inc. | 454,500 | 42,432 | ||||||
| Monster Beverage Corp.1 | 719,328 | 39,671 | ||||||
| Ocado Group PLC1 | 4,795,032 | 36,321 | ||||||
| Maplebear, Inc. (DBA Instacart)1 | 1,228,755 | 27,346 | ||||||
| Target Corp. | 142,524 | 19,071 | ||||||
| 556,779 | ||||||||
| Materials 1.15% | ||||||||
| Linde PLC | 253,463 | 104,875 | ||||||
| Air Products and Chemicals, Inc. | 358,159 | 96,900 | ||||||
| Air Liquide SA | 466,997 | 88,347 | ||||||
| Corteva, Inc. | 1,039,885 | 47,003 | ||||||
| 337,125 | ||||||||
| Utilities 1.14% | ||||||||
| PG&E Corp. | 10,951,195 | 188,032 | ||||||
| AES Corp. | 5,109,896 | 87,942 | ||||||
| NextEra Energy, Inc. | 1,019,694 | 59,662 | ||||||
| 335,636 | ||||||||
| Common stocks (continued) | Shares | Value (000) |
||||||
| Real estate 0.08% | ||||||||
| Zillow Group, Inc., Class C, nonvoting shares1 | 406,420 | $ | 16,639 | |||||
| Equinix, Inc. REIT | 9,603 | 7,827 | ||||||
| 24,466 | ||||||||
| Total common stocks (cost: $18,713,906,000) | 27,761,804 | |||||||
| Preferred securities 0.04% | ||||||||
| Information technology 0.04% | ||||||||
| Stripe, Inc., Series BB-1, 6.00% noncumulative preferred shares1,3,4 | 218,360 | 4,837 | ||||||
| Stripe, Inc., Series G, 6.00% noncumulative preferred shares1,3,4 | 128,963 | 2,856 | ||||||
| Stripe, Inc., Series BB, 6.00% noncumulative preferred shares1,3,4 | 77,454 | 1,716 | ||||||
| Stripe, Inc., Series H, 6.00% noncumulative preferred shares1,3,4 | 22,617 | 501 | ||||||
| Total preferred securities (cost: $10,136,000) | 9,910 | |||||||
| Convertible stocks 0.11% | ||||||||
| Information technology 0.11% | ||||||||
| Tarana Wireless, Inc., Series 6, noncumulative convertible preferred shares3,4 | 30,562,347 | 32,683 | ||||||
| Tarana Wireless, Inc., Series 7, noncumulative convertible preferred shares3,4 | 922,043 | 986 | ||||||
| Total convertible stocks (cost: $25,986,000) | 33,669 | |||||||
| Convertible bonds & notes 0.20% | Principal amount (000) |
|||||||
| Consumer discretionary 0.20% | ||||||||
| Rivian Automotive, Inc., convertible notes, 4.625% 3/15/20296 | USD | 9,991 | 11,035 | |||||
| Rivian Automotive, Inc., convertible notes, 3.625% 10/15/20306 | 50,000 | 48,220 | ||||||
| Total convertible bonds & notes (cost: $59,991,000) | 59,255 | |||||||
| Short-term securities 5.34% | Shares | |||||||
| Money market investments 5.28% | ||||||||
| Capital Group Central Cash Fund 5.46%5,7 | 15,478,457 | 1,547,846 | ||||||
| Money market investments purchased with collateral from securities on loan 0.06% | ||||||||
| State Street Institutional U.S. Government Money Market Fund, Institutional Class 5.28%7,8 | 8,887,833 | 8,888 | ||||||
| Invesco Short-Term Investments Trust – Government & Agency Portfolio, Institutional Class 5.28%7,8 | 7,747,857 | 7,748 | ||||||
| Capital Group Central Cash Fund 5.46%5,7,8 | 21,915 | 2,191 | ||||||
| 18,827 | ||||||||
| Total short-term securities (cost: $1,566,423,000) | 1,566,673 | |||||||
| Total investment securities 100.32% (cost: $20,376,442,000) | 29,431,311 | |||||||
| Other assets less liabilities (0.32%) | (95,025 | ) | ||||||
| Net assets 100.00% | $ | 29,336,286 | ||||||
Investments in affiliates5
| Value at 12/1/2022 (000) |
Additions (000) |
Reductions (000) |
Net realized gain (loss) (000) |
Net unrealized appreciation (depreciation) (000) |
Value at 11/30/2023 (000) |
Dividend or interest income (000) |
||||||||||||||||||||||
| Common stocks 0.91% | ||||||||||||||||||||||||||||
| Health care 0.91% | ||||||||||||||||||||||||||||
| agilon health, Inc.1,2 | $ | 208,917 | $ | 186,418 | $ | 359 | $ | 290 | $ | (159,390 | ) | $ | 235,876 | $ | — | |||||||||||||
| Revance Therapeutics, Inc.1 | 41,858 | 54,328 | 14,458 | (2,761 | ) | (48,646 | ) | 30,321 | — | |||||||||||||||||||
| 266,197 | ||||||||||||||||||||||||||||
| Short-term securities 5.29% | ||||||||||||||||||||||||||||
| Money market investments 5.28% | ||||||||||||||||||||||||||||
| Capital Group Central Cash Fund 5.46%7 | 2,988,551 | 3,722,406 | 5,163,355 | 159 | 85 | 1,547,846 | 98,801 | |||||||||||||||||||||
| Money market investments purchased with collateral from securities on loan 0.01% | ||||||||||||||||||||||||||||
| Capital Group Central Cash Fund 5.46%7,8 | 32,169 | 29,978 | 9 | 2,191 | — | 10 | ||||||||||||||||||||||
| Total short-term securities | 1,550,037 | |||||||||||||||||||||||||||
| Total 6.20% | $ | (2,312 | ) | $ | (207,951 | ) | $ | 1,816,234 | $ | 98,801 | ||||||||||||||||||
Restricted securities4
| Acquisition date(s) |
Cost (000) |
Value (000) |
Percent of net assets |
|||||||||||
| Epic Games, Inc.1,3 | 3/29/2021 | $ | 74,728 | $ | 45,326 | .15 | % | |||||||
| Tarana Wireless, Inc., Series 6, noncumulative convertible preferred shares3 | 2/18/2022 | 25,000 | 32,683 | .11 | ||||||||||
| Tarana Wireless, Inc., Series 7, noncumulative convertible preferred shares3 | 6/27/2023 | 986 | 986 | .01 | ||||||||||
| Stripe, Inc., Series BB-1, 6.00% noncumulative preferred shares1,3 | 8/24/2023 | 4,703 | 4,837 | .02 | ||||||||||
| Stripe, Inc., Series G, 6.00% noncumulative preferred shares1,3 | 9/29/2023 | 2,857 | 2,856 | .01 | ||||||||||
| Stripe, Inc., Series BB, 6.00% noncumulative preferred shares1,3 | 8/24/2023 | 1,668 | 1,716 | .01 | ||||||||||
| Stripe, Inc., Class B1,3 | 5/6/2021 – 8/24/2023 | 2,346 | 1,408 | .0011 | ||||||||||
| Stripe, Inc., Series H, 6.00% noncumulative preferred shares1,3 | 3/15/2021 | 908 | 501 | .0011 | ||||||||||
| Total | $ | 113,196 | $ | 90,313 | .31 | % | ||||||||
| 1 | Security did not produce income during the last 12 months. |
| 2 | All or a portion of this security was on loan. The total value of all such securities was $49,919,000, which represented .17% of the net assets of the fund. Refer to Note 5 for more information on securities lending. |
| 3 | Value determined using significant unobservable inputs. |
| 4 | Restricted security, other than Rule 144A securities or commercial paper issued pursuant to Section 4(a)(2) of the Securities Act of 1933. The total value of all such restricted securities was $90,313,000, which represented .31% of the net assets of the fund. |
| 5 | Affiliate of the fund or part of the same “group of investment companies” as the fund, as defined under the Investment Company Act of 1940, as amended. |
| 6 | Acquired in a transaction exempt from registration under Rule 144A or, for commercial paper, Section 4(a)(2) of the Securities Act of 1933. May be resold in the U.S. in transactions exempt from registration, normally to qualified institutional buyers. The total value of all such securities was $59,255,000, which represented .20% of the net assets of the fund. |
| 7 | Rate represents the seven-day yield at 11/30/2023. |
| 8 | Security purchased with cash collateral from securities on loan. Refer to Note 5 for more information on securities lending. |
| 9 | Represents net activity. Refer to Note 5 for more information on securities lending. |
| 10 | Dividend income is included with securities lending income in the fund’s statement of operations and is not shown in this table. |
| 11 | Amount less than .01%. |
Key to abbreviation(s)
ADR = American Depositary Receipts
REIT = Real Estate Investment Trust
USD = U.S. dollars
Refer to the notes to financial statements.
Financial statements
| Statement of assets and liabilities at November 30, 2023 |
(dollars in thousands) |
| Assets: | ||||||||
| Investment securities, at value (includes $49,919 of investment securities on loan): | ||||||||
| Unaffiliated issuers (cost: $18,461,127) | $ | 27,615,077 | ||||||
| Affiliated issuers (cost: $1,915,315) | 1,816,234 | $ | 29,431,311 | |||||
| Cash | 25,827 | |||||||
| Cash denominated in currencies other than U.S. dollars (cost: $47) | 47 | |||||||
| Cash collateral received for securities on loan | 2,092 | |||||||
| Receivables for: | ||||||||
| Sales of investments | 94,220 | |||||||
| Sales of fund’s shares | 12,332 | |||||||
| Dividends and interest | 23,522 | |||||||
| Securities lending income | 1 | |||||||
| Other | 245 | 130,320 | ||||||
| 29,589,597 | ||||||||
| Liabilities: | ||||||||
| Collateral for securities on loan | 20,919 | |||||||
| Payables for: | ||||||||
| Purchases of investments | 180,679 | |||||||
| Repurchases of fund’s shares | 34,944 | |||||||
| Investment advisory services | 8,703 | |||||||
| Services provided by related parties | 4,689 | |||||||
| Trustees’ deferred compensation | 3,019 | |||||||
| Other | 358 | 232,392 | ||||||
| Net assets at November 30, 2023 | $ | 29,336,286 | ||||||
| Net assets consist of: | ||||||||
| Capital paid in on shares of beneficial interest | $ | 19,147,852 | ||||||
| Total distributable earnings | 10,188,434 | |||||||
| Net assets at November 30, 2023 | $ | 29,336,286 | ||||||
Refer to the notes to financial
statements.
Financial statements (continued)
Statement of assets and liabilities
at November 30, 2023 (continued)
(dollars and shares in thousands, except per-share
amounts)
Shares of beneficial interest issued and outstanding (no stated
par value) —
unlimited shares authorized (550,928 total shares outstanding)
| Net assets | Shares outstanding |
Net asset value per share |
||||||||||
| Class A | $ | 14,298,840 | 268,375 | $ | 53.28 | |||||||
| Class C | 287,168 | 6,434 | 44.63 | |||||||||
| Class T | 14 | — | * | 53.55 | ||||||||
| Class F-1 | 219,277 | 4,104 | 53.43 | |||||||||
| Class F-2 | 2,586,606 | 48,402 | 53.44 | |||||||||
| Class F-3 | 1,153,332 | 21,477 | 53.70 | |||||||||
| Class 529-A | 878,904 | 16,738 | 52.51 | |||||||||
| Class 529-C | 26,062 | 575 | 45.32 | |||||||||
| Class 529-E | 31,363 | 615 | 51.04 | |||||||||
| Class 529-T | 19 | — | * | 53.48 | ||||||||
| Class 529-F-1 | 11 | — | * | 52.60 | ||||||||
| Class 529-F-2 | 102,163 | 1,911 | 53.46 | |||||||||
| Class 529-F-3 | 11 | — | * | 53.44 | ||||||||
| Class R-1 | 27,428 | 589 | 46.58 | |||||||||
| Class R-2 | 181,531 | 3,868 | 46.93 | |||||||||
| Class R-2E | 13,970 | 273 | 51.14 | |||||||||
| Class R-3 | 254,195 | 4,971 | 51.14 | |||||||||
| Class R-4 | 247,206 | 4,695 | 52.66 | |||||||||
| Class R-5E | 75,080 | 1,414 | 53.10 | |||||||||
| Class R-5 | 77,809 | 1,441 | 54.00 | |||||||||
| Class R-6 | 8,875,297 | 165,046 | 53.77 | |||||||||
| * | Amount less than one thousand. |
Refer to the notes to financial statements.
Financial statements (continued)
| Statement of operations for the year ended November 30, 2023 |
(dollars in thousands) |
| Investment income: | ||||||||
| Income: | ||||||||
| Dividends (net of non-U.S. taxes of $7,036; also includes $98,801 from affiliates) | $ | 333,385 | ||||||
| Securities lending income (net of fees) | 2,504 | |||||||
| Interest from unaffiliated issuers | 991 | $ | 336,880 | |||||
| Fees and expenses*: | ||||||||
| Investment advisory services | 101,010 | |||||||
| Distribution services | 40,991 | |||||||
| Transfer agent services | 21,359 | |||||||
| Administrative services | 8,148 | |||||||
| 529 plan services | 579 | |||||||
| Reports to shareholders | 714 | |||||||
| Registration statement and prospectus | 684 | |||||||
| Trustees’ compensation | 353 | |||||||
| Auditing and legal | 189 | |||||||
| Custodian | 784 | |||||||
| Other | 117 | 174,928 | ||||||
| Net investment income | 161,952 | |||||||
| Net realized gain and unrealized appreciation: | ||||||||
| Net realized gain (loss) on: | ||||||||
| Investments (net of non-U.S. taxes of $9,703): | ||||||||
| Unaffiliated issuers | 1,288,877 | |||||||
| Affiliated issuers | (2,312 | ) | ||||||
| In-kind redemptions | 12,621 | |||||||
| Currency transactions | (419 | ) | 1,298,767 | |||||
| Net unrealized appreciation (depreciation) on: | ||||||||
| Investments (net of non-U.S. taxes of $22): | ||||||||
| Unaffiliated issuers | 3,079,959 | |||||||
| Affiliated issuers | (207,951 | ) | ||||||
| Currency translations | 290 | 2,872,298 | ||||||
| Net realized gain and unrealized appreciation | 4,171,065 | |||||||
| Net increase in net assets resulting from operations | $ | 4,333,017 | ||||||
| * | Additional information related to class-specific fees and expenses is included in the notes to financial statements. |
Refer to the notes to financial statements.
Financial statements (continued)
| Statements of changes in net assets | (dollars in thousands) |
| Year ended November 30, | ||||||||
| 2023 | 2022 | |||||||
| Operations: | ||||||||
| Net investment income | $ | 161,952 | $ | 73,672 | ||||
| Net realized gain (loss) | 1,298,767 | (257,253 | ) | |||||
| Net unrealized appreciation (depreciation) | 2,872,298 | (8,485,629 | ) | |||||
| Net increase (decrease) in net assets resulting from operations | 4,333,017 | (8,669,210 | ) | |||||
| Distributions paid to shareholders | (29,919 | ) | (2,477,948 | ) | ||||
| Net capital share transactions | (681,405 | ) | 2,258,933 | |||||
| Total increase (decrease) in net assets | 3,621,693 | (8,888,225 | ) | |||||
| Net assets: | ||||||||
| Beginning of year | 25,714,593 | 34,602,818 | ||||||
| End of year | $ | 29,336,286 | $ | 25,714,593 | ||||
Refer to the notes to financial statements.
Notes to financial statements
1. Organization
The New Economy Fund (the “fund”) is registered under the Investment Company Act of 1940,
as amended (the “1940 Act”), as an open-end, diversified management investment company. The fund seeks long-term growth
of capital.
The fund has 21 share classes consisting of six retail share classes (Classes A, C, T, F-1, F-2 and F-3),
seven 529 college savings plan share classes (Classes 529-A, 529-C, 529-E, 529-T, 529-F-1, 529-F-2 and 529-F-3) and eight retirement
plan share classes (Classes R-1, R-2, R-2E, R-3, R-4, R-5E, R-5 and R-6). The 529 college savings plan share classes can be used
to save for college education. The retirement plan share classes are generally offered only through eligible employer-sponsored
retirement plans. The fund’s share classes are described further in the following table:
| Share class | Initial sales charge | Contingent deferred sales charge upon redemption |
Conversion feature | |||
| Classes A and 529-A | Up to 5.75% for Class A; up to 3.50% for Class 529-A | None (except 1.00% for certain redemptions within 18 months of purchase without an initial sales charge) | None | |||
| Classes C and 529-C | None | 1.00% for redemptions within one year of purchase | Class C converts to Class A after eight years and Class 529-C converts to Class 529-A after five years | |||
| Class 529-E | None | None | None | |||
| Classes T and 529-T* | Up to 2.50% | None | None | |||
| Classes F-1, F-2, F-3, 529-F-1, 529-F-2 and 529-F-3 |
None | None | None | |||
| Classes R-1, R-2, R-2E, R-3, R-4, R-5E, R-5 and R-6 |
None | None | None |
| * | Class T and 529-T shares are not available for purchase. |
Holders of all share classes have equal pro rata rights to the assets, dividends and liquidation proceeds
of the fund. Each share class has identical voting rights, except for the exclusive right to vote on matters affecting only its
class. Share classes have different fees and expenses (“class-specific fees and expenses”), primarily due to different
arrangements for distribution, transfer agent and administrative services. Differences in class-specific fees and expenses will
result in differences in net investment income and, therefore, the payment of different per-share dividends by each share class.
2. Significant accounting policies
The fund is an investment company that applies the accounting and reporting guidance issued in Topic
946 by the U.S. Financial Accounting Standards Board. The fund’s financial statements have been prepared to comply with
U.S. generally accepted accounting principles (“U.S. GAAP”). These principles require the fund’s investment
adviser to make estimates and assumptions that affect reported amounts and disclosures. Actual results could differ from those
estimates. Subsequent events, if any, have been evaluated through the date of issuance in the preparation of the financial statements.
The fund follows the significant accounting policies described in this section, as well as the valuation policies described in
the next section on valuation.
Security transactions and related investment income — Security transactions are recorded
by the fund as of the date the trades are executed with brokers. Realized gains and losses from security transactions are determined
based on the specific identified cost of the securities. In the event a security is purchased with a delayed payment date, the
fund will segregate liquid assets sufficient to meet its payment obligations. Dividend income is recognized on the ex-dividend
date and interest income is recognized on an accrual basis. Market discounts, premiums and original issue discounts on fixed-income
securities are amortized daily over the expected life of the security.
Class allocations — Income, fees and expenses (other than class-specific fees and expenses),
realized gains and losses and unrealized appreciation and depreciation are allocated daily among the various share classes based
on their relative net assets. Class-specific fees and expenses, such as distribution, transfer agent and administrative services,
are charged directly to the respective share class.
Distributions paid to shareholders — Income dividends and capital gain distributions are
recorded on the ex-dividend date.
Currency translation — Assets and liabilities, including investment securities, denominated
in currencies other than U.S. dollars are translated into U.S. dollars at the exchange rates supplied by one or more pricing vendors
on the valuation date. Purchases and sales of investment securities and income and expenses are translated into U.S. dollars at
the exchange rates on the dates of such transactions. The effects of changes in exchange rates on investment securities are included
with the net realized gain or loss and net unrealized appreciation or depreciation on investments in the fund’s statement
of operations. The realized gain or loss and unrealized appreciation or depreciation resulting from all other transactions denominated
in currencies other than U.S. dollars are disclosed separately.
In-kind redemptions — The fund normally redeems shares in cash; however, under certain conditions
and circumstances, payment of the redemption price wholly or partly with portfolio securities or other fund assets may be permitted.
A redemption of shares in-kind is based upon the closing value of the shares being redeemed as of the trade date. Realized gains
or losses resulting from redemptions of shares in-kind are reflected separately in the fund’s statement of operations.
3. Valuation
Capital Research and Management Company (“CRMC”), the fund’s investment adviser, values
the fund’s investments at fair value as defined by U.S. GAAP. The net asset value per share is calculated once daily as
of the close of regular trading on the New York Stock Exchange, normally 4 p.m. New York time, each day the New York Stock Exchange
is open.
Methods and inputs — The fund’s investment adviser uses the following methods and
inputs to establish the fair value of the fund’s assets and liabilities. Use of particular methods and inputs may vary over
time based on availability and relevance as market and economic conditions evolve.
Equity securities, including depositary receipts, are generally valued at the official closing price
of, or the last reported sale price on, the exchange or market on which such securities are traded, as of the close of business
on the day the securities are being valued or, lacking any sales, at the last available bid price. Prices for each security are
taken from the principal exchange or market on which the security trades.
Fixed-income securities, including short-term securities, are generally valued at evaluated prices obtained
from third-party pricing vendors. Vendors value such securities based on one or more of the inputs described in the following
table. The table provides examples of inputs that are commonly relevant for valuing particular classes of fixed-income securities
in which the fund is authorized to invest. However, these classifications are not exclusive, and any of the inputs may be used
to value any other class of fixed-income security.
| Fixed-income class | Examples of standard inputs | |
| All | Benchmark yields, transactions, bids, offers, quotations from dealers and trading systems, new issues, spreads and other relationships observed in the markets among comparable securities; and proprietary pricing models such as yield measures calculated using factors such as cash flows, financial or collateral performance and other reference data (collectively referred to as “standard inputs”) |
|
| Corporate bonds, notes & loans; convertible securities | Standard inputs and underlying equity of the issuer | |
| Bonds & notes of governments & government agencies | Standard inputs and interest rate volatilities | |
| Mortgage-backed; asset-backed obligations | Standard inputs and cash flows, prepayment information, default rates, delinquency and loss assumptions, collateral characteristics, credit enhancements and specific deal information |
Securities with both fixed-income and equity characteristics, or equity securities traded principally
among fixed-income dealers, are generally valued in the manner described for either equity or fixed-income securities, depending
on which method is deemed most appropriate by the fund’s investment adviser. The Capital Group Central Cash Fund (“CCF”),
a fund within the Capital Group Central Fund Series (“Central Funds”), is valued based upon a floating net asset value,
which fluctuates with changes in the value of CCF’s portfolio securities. The underlying securities are valued based on
the policies and procedures in CCF’s statement of additional information.
Securities and other assets for which representative market quotations are not readily available or are
considered unreliable by the fund’s investment adviser are fair valued as determined in good faith under fair valuation
guidelines adopted by the fund’s investment adviser and approved by the board of trustees as further described. The investment
adviser follows fair valuation guidelines, consistent with U.S. Securities and Exchange Commission rules and guidance, to consider
relevant principles and factors when making fair value determinations. The investment adviser considers relevant indications of
value that are reasonably and timely available to it in determining the fair value to be assigned to a particular security, such
as the type and cost of the security, contractual or legal restrictions on resale of the security, relevant financial or business
developments of the issuer, actively traded similar or related securities, dealer or broker quotes, conversion or exchange rights
on the security, related corporate actions, significant events occurring after the close of trading in the security, and changes
in overall market conditions. In addition, the closing prices of equity securities that trade in markets outside U.S. time zones
may be adjusted to reflect significant events that occur after the close of local trading but before the net asset value of each
share class of the fund is determined. Fair valuations of investments that are not actively trading involve judgment and may differ
materially from valuations that would have been used had greater market activity occurred.
Processes and structure — The fund’s board of trustees has designated the fund’s
investment adviser to make fair value determinations, subject to board oversight. The investment adviser has established a Joint
Fair Valuation Committee (the “Committee”) to administer, implement and oversee the fair valuation process and to
make fair value decisions. The Committee regularly reviews its own fair value decisions, as well as decisions made under its standing
instructions to the investment adviser’s valuation team. The Committee reviews changes in fair value measurements from period
to period, pricing vendor information and market data, and may, as deemed appropriate, update the fair valuation guidelines to
better reflect the results of back testing and address new or evolving issues. Pricing decisions, processes and controls over
security valuation are also subject to additional internal reviews facilitated by the investment adviser’s global risk management
group. The Committee reports changes to the fair valuation guidelines to the board of trustees. The fund’s board and audit
committee also regularly review reports that describe fair value determinations and methods.
Classifications — The fund’s investment adviser classifies the fund’s assets
and liabilities into three levels based on the inputs used to value the assets or liabilities. Level 1 values are based on quoted
prices in active markets for identical securities. Level 2 values are based on significant observable market inputs, such as quoted
prices for similar securities and quoted prices in inactive markets. Certain securities trading outside the U.S. may transfer
between Level 1 and Level 2 due to valuation adjustments resulting from significant market movements following the close of local
trading. Level 3 values are based on significant unobservable inputs that reflect the investment adviser’s determination
of assumptions that market participants might reasonably use in valuing the securities. The valuation levels are not necessarily
an indication of the risk or liquidity associated with the underlying investment. For example, U.S. government securities are
reflected as Level 2 because the inputs used to determine fair value may not always be quoted prices in an active market. The
following table presents the fund’s valuation levels as of November 30, 2023 (dollars in thousands):
| Investment securities | ||||||||||||||||
| Level 1 | Level 2 | Level 3 | Total | |||||||||||||
| Assets: | ||||||||||||||||
| Common stocks: | ||||||||||||||||
| Information technology | $ | 9,203,545 | $ | — | $ | 1,408 | $ | 9,204,953 | ||||||||
| Health care | 5,827,434 | — | — | 5,827,434 | ||||||||||||
| Financials | 3,426,005 | — | — | 3,426,005 | ||||||||||||
| Consumer discretionary | 2,767,528 | — | — | 2,767,528 | ||||||||||||
| Industrials | 2,507,597 | — | — | 2,507,597 | ||||||||||||
| Communication services | 1,774,140 | — | 45,326 | 1,819,466 | ||||||||||||
| Energy | 954,815 | — | — | 954,815 | ||||||||||||
| Consumer staples | 529,433 | 27,346 | — | 556,779 | ||||||||||||
| Materials | 337,125 | — | — | 337,125 | ||||||||||||
| Utilities | 335,636 | — | — | 335,636 | ||||||||||||
| Real estate | 24,466 | — | — | 24,466 | ||||||||||||
| Preferred securities | — | — | 9,910 | 9,910 | ||||||||||||
| Convertible stocks | — | — | 33,669 | 33,669 | ||||||||||||
| Convertible bonds & notes | — | 59,255 | — | 59,255 | ||||||||||||
| Short-term securities | 1,566,673 | — | — | 1,566,673 | ||||||||||||
| Total | $ | 29,254,397 | $ | 86,601 | $ | 90,313 | $ | 29,431,311 | ||||||||
4. Risk factors
Investing in the fund may involve certain risks including, but not limited to, those described below.
Market conditions — The prices of, and the income generated by, the common stocks and other
securities held by the fund may decline —sometimes rapidly or unpredictably — due to various factors, including events
or conditions affecting the general economy or particular industries or companies; overall market changes; local, regional or
global political, social or economic instability; governmental, governmental agency or central bank responses to economic conditions;
changes in inflation rates; and currency exchange rate, interest rate and commodity price fluctuations.
Economies and financial markets throughout the world are highly interconnected. Economic, financial or
political events, trading and tariff arrangements, wars, terrorism, cybersecurity events, natural disasters, public health emergencies
(such as the spread of infectious disease), bank failures and other circumstances in one country or region, including actions
taken by governmental or quasi-governmental authorities in response to any of the foregoing, could have impacts on global economies
or markets. As a result, whether or not the fund invests in securities of issuers located in or with significant exposure to the
countries affected, the value and liquidity of the fund’s investments may be negatively affected by developments in other
countries and regions.
Issuer risks — The prices of, and the income generated by, securities held by the fund may
decline in response to various factors directly related to the issuers of such securities, including reduced demand for an issuer’s
goods or services, poor management performance, major litigation, investigations or other controversies related to the issuer,
changes in the issuer’s financial condition or credit rating, changes in government regulations affecting the issuer or
its competitive environment and strategic initiatives such as mergers, acquisitions or dispositions and the market response to
any such initiatives. An individual security may also be affected by factors relating to the industry or sector of the issuer
or the securities markets as a whole, and conversely an industry or sector or the securities markets may be affected by a change
in financial condition or other event affecting a single issuer.
Investing in growth-oriented stocks — Growth-oriented common stocks and other equity-type
securities (such as preferred stocks, convertible preferred stocks and convertible bonds) may involve larger price swings and
greater potential for loss than other types of investments. These risks may be even greater in the case of smaller capitalization
stocks.
Investing in income-oriented stocks — The value of the fund’s securities and income
provided by the fund may also be reduced by changes in the dividend policies of, and the capital resources available for dividend
payments at, the companies in which the fund invests.
Investing outside the U.S. — Securities of issuers domiciled outside the U.S., or with significant
operations or revenues outside the U.S., and securities tied economically to countries outside the U.S., may lose value because
of adverse political, social, economic or market developments (including social instability, regional conflicts, terrorism and
war) in the countries or regions in which the issuers are domiciled, operate or generate revenue or to which the securities are
tied economically. These securities may also lose value due to changes in foreign currency exchange rates against the U.S. dollar
and/or currencies of other countries. Issuers of these securities may be more susceptible to actions of foreign governments, such
as nationalization, currency blockage or the imposition of price controls, sanctions, or punitive taxes, each of which could adversely
impact the value of these securities. Securities markets in certain countries may be more volatile and/or less liquid than those
in the U.S. Investments outside the U.S. may also be subject to different regulatory, legal, accounting, auditing, financial reporting
and recordkeeping requirements, and may be more difficult to value, than those in the U.S. In addition, the value of investments
outside the U.S. may be reduced by foreign taxes, including foreign withholding taxes on interest and dividends. Further, there
may be increased risks of delayed settlement of securities purchased or sold by the fund, which could impact the liquidity of
the fund’s portfolio. The risks of investing outside the U.S. may be heightened in connection with investments in emerging
markets.
Investing in emerging markets — Investing in emerging markets may involve risks in addition
to and greater than those generally associated with investing in the securities markets of developed countries. For instance,
emerging market countries tend to have less developed political, economic and legal systems than those in developed countries.
Accordingly, the governments of these countries may be less stable and more likely to intervene in the market economy, for example,
by imposing capital controls, nationalizing a company or industry, placing restrictions on foreign ownership and on withdrawing
sale proceeds of securities from the country, and/or imposing punitive taxes that could adversely affect the prices of securities.
Information regarding issuers in emerging markets may be limited, incomplete or inaccurate, and such issuers may not be subject
to regulatory, accounting, auditing, and financial reporting and recordkeeping standards comparable to those to which issuers
in more developed markets are subject. The fund’s rights with respect to its investments in emerging markets, if any, will
generally be governed by local law, which may make it difficult or impossible for the fund to pursue legal remedies or to obtain
and enforce judgments in local courts. In addition, the economies of these countries may be dependent on relatively few industries,
may have limited access to capital and may be more susceptible to changes in local and global trade conditions and downturns in
the world economy. Securities markets in these countries can also be relatively small and have substantially lower trading volumes.
As a result, securities issued in these countries may be more volatile and less liquid, more vulnerable to market manipulation,
and more difficult to value, than securities issued in countries with more developed economies and/or markets. Less certainty
with respect to security valuations may lead to additional challenges and risks in calculating the fund’s net asset value.
Additionally, emerging markets are more likely to experience problems with the clearing and settling of trades and the holding
of securities by banks, agents and depositories that are less established than those in developed countries.
Investing in small companies — Investing in smaller companies may pose additional risks.
For example, it is often more difficult to value or dispose of small company stocks and more difficult to obtain information about
smaller companies than about larger companies. Furthermore, smaller companies often have limited product lines, operating histories,
markets and/or financial resources, may be dependent on one or a few key persons for management, and can be more susceptible to
losses. Moreover, the prices of their stocks may be more volatile than stocks of larger, more established companies, particularly
during times of market turmoil.
Exposure to country, region, industry or sector — Subject to the fund’s investment
limitations, the fund may have significant exposure to a particular country, region, industry or sector. Such exposure may cause
the fund to be more impacted by risks relating to and developments affecting the country, region, industry or sector, and thus
its net asset value may be more volatile, than a fund without such levels of exposure. For example, if the fund has significant
exposure in a particular country, then social, economic, regulatory or other issues that negatively affect that country may have
a greater impact on the fund than on a fund that is more geographically diversified.
Management — The investment adviser to the fund actively manages the fund’s investments.
Consequently, the fund is subject to the risk that the methods and analyses, including models, tools and data, employed by the
investment adviser in this process may be flawed or incorrect and may not produce the desired results. This could cause the fund
to lose value or its investment results to lag relevant benchmarks or other funds with similar objectives.
5. Certain investment techniques
Securities lending — The fund has entered into securities lending transactions in which
the fund earns income by lending investment securities to brokers, dealers or other institutions. Each transaction involves three
parties: the fund, acting as the lender of the securities, a borrower, and a lending agent that acts as an intermediary.
Securities lending transactions are entered into by the fund under a securities lending agent agreement
with the lending agent. The lending agent facilitates the exchange of securities between the fund and approved borrowers, ensures
that securities loans are properly coordinated and documented, marks-to-market the value of collateral daily, secures additional
collateral from a borrower if it falls below preset terms, and may reinvest cash collateral on behalf of the fund according to
agreed parameters. The lending agent provides indemnification to the fund against losses resulting from a borrower default. Although
risk is mitigated by the collateral and indemnification, the fund could experience a delay in recovering its securities and a
potential loss of income or value if a borrower fails to return securities, collateral investments decline in value or the lending
agent fails to perform.
The borrower is required to post highly liquid assets, such as cash or U.S. government securities, as
collateral for the loan in an amount at least equal to the value of the securities loaned. Investments made with cash collateral
are recognized as assets in the fund’s investment portfolio. The same amount is recorded as a liability in the fund’s
statement of assets and liabilities. While securities are on loan, the fund will continue to receive the equivalent of the interest,
dividends or other distributions paid by the issuer, as well as a portion of the interest on the investment of the collateral.
Additionally, although the fund does not have the right to vote on securities while they are on loan, the fund has a right to
consent on corporate actions and a right to recall loaned securities to vote. A borrower is obligated to return loaned securities
at the conclusion of a loan or, during the pendency of a loan, on demand from the fund.
As of November 30, 2023, the total value of securities on loan was $49,919,000, and the total value of
collateral received was $51,898,000. Collateral received includes cash of $20,919,000 and U.S. government securities of $30,979,000.
Investment securities purchased from cash collateral are disclosed in the fund’s investment portfolio as short-term securities.
Securities received as collateral are not recognized as fund assets. The contractual maturity of cash collateral received under
the securities lending agreement is classified as overnight and continuous.
6. Taxation and distributions
Federal income taxation — The fund complies with the requirements under Subchapter M of
the Internal Revenue Code applicable to regulated investment companies and intends to distribute substantially all of its net
taxable income and net capital gains each year. The fund is not subject to income taxes to the extent such distributions are made.
Therefore, no federal income tax provision is required.
As of and during the year ended November 30, 2023, the fund did not have a liability for any unrecognized
tax benefits. The fund recognizes interest and penalties, if any, related to unrecognized tax benefits as income tax expense in
the statement of operations. During the year, the fund did not incur any significant interest or penalties.
The fund’s tax returns are generally not subject to examination by federal, state and, if applicable,
non-U.S. tax authorities after the expiration of each jurisdiction’s statute of limitations, which is typically three years
after the date of filing but can be extended in certain jurisdictions.
Non-U.S. taxation — Dividend and interest income are recorded net of non-U.S. taxes paid.
The fund may file withholding tax reclaims in certain jurisdictions to recover a portion of amounts previously withheld. As a
result of rulings from European courts, the fund filed for additional reclaims related to prior years. These reclaims are recorded
when the amount is known and there are no significant uncertainties on collectability. During the year ended November 30, 2023,
the fund recognized $607,000 in reclaims (net of $6,000 in fees and the effect of realized gain or loss from currency translations)
and $11,000 in interest related to European court rulings, which is included in dividend income and interest income, respectively,
in the fund’s statement of operations. Gains realized by the fund on the sale of securities in certain countries, if any,
may be subject to non-U.S. taxes. The fund generally records an estimated deferred tax liability based on unrealized gains to
provide for potential non-U.S. taxes payable upon the sale of these securities.
Distributions — Distributions determined on a tax basis may differ from net investment income
and net realized gains for financial reporting purposes. These differences are due primarily to different treatment for items
such as currency gains and losses; short-term capital gains and losses; capital losses related to sales of certain securities
within 30 days of purchase; cost of investments sold; net capital losses and non-U.S. taxes on capital gains. The fiscal year
in which amounts are distributed may differ from the year in which the net investment income and net realized gains are recorded
by the fund for financial reporting purposes. The fund may also designate a portion of the amount paid to redeeming shareholders
as a distribution for tax purposes.
During the year ended November 30, 2023, the fund reclassified $55,677,000 from total distributable earnings
to capital paid in on shares of beneficial interest to align financial reporting with tax reporting. The fund also utilized capital
loss carryforward of $224,512,000.
As of November 30, 2023, the tax basis components of distributable earnings, unrealized appreciation
(depreciation) and cost of investments were as follows (dollars in thousands):
| Undistributed ordinary income | $ | 108,262 | ||
| Undistributed long-term capital gains | 1,104,679 | |||
| Post-October capital loss deferral* | (57,748 | ) | ||
| Gross unrealized appreciation on investments | 9,784,276 | |||
| Gross unrealized depreciation on investments | (748,233 | ) | ||
| Net unrealized appreciation on investments | 9,036,043 | |||
| Cost of investments | 20,395,268 |
| * | This deferral is considered incurred in the subsequent year. |
Distributions paid were characterized for tax purposes as follows (dollars in thousands):
| Year ended November 30, 2023 | Year ended November 30, 2022 | |||||||||||||||||||||||
| Share class | Ordinary income |
Long-term capital gains |
Total distributions paid |
Ordinary income |
Long-term capital gains |
Total distributions paid |
||||||||||||||||||
| Class A | $ | — | $ | — | $ | — | $ | — | $ | 1,325,779 | $ | 1,325,779 | ||||||||||||
| Class C | — | — | — | — | 44,176 | 44,176 | ||||||||||||||||||
| Class T | — | * | — | — | * | — | 1 | 1 | ||||||||||||||||
| Class F-1 | — | — | — | — | 24,430 | 24,430 | ||||||||||||||||||
| Class F-2 | 4,009 | — | 4,009 | — | 216,587 | 216,587 | ||||||||||||||||||
| Class F-3 | 3,054 | — | 3,054 | — | 94,644 | 94,644 | ||||||||||||||||||
| Class 529-A | — | — | — | — | 80,254 | 80,254 | ||||||||||||||||||
| Class 529-C | — | — | — | — | 4,216 | 4,216 | ||||||||||||||||||
| Class 529-E | — | — | — | — | 3,139 | 3,139 | ||||||||||||||||||
| Class 529-T | — | * | — | — | * | — | 2 | 2 | ||||||||||||||||
| Class 529-F-1 | — | * | — | — | * | — | 1 | 1 | ||||||||||||||||
| Class 529-F-2 | 157 | — | 157 | — | 7,663 | 7,663 | ||||||||||||||||||
| Class 529-F-3 | — | * | — | — | * | — | 1 | 1 | ||||||||||||||||
| Class R-1 | — | — | — | — | 3,178 | 3,178 | ||||||||||||||||||
| Class R-2 | — | — | — | — | 19,354 | 19,354 | ||||||||||||||||||
| Class R-2E | — | — | — | — | 1,090 | 1,090 | ||||||||||||||||||
| Class R-3 | — | — | — | — | 24,844 | 24,844 | ||||||||||||||||||
| Class R-4 | — | — | — | — | 24,674 | 24,674 | ||||||||||||||||||
| Class R-5E | 88 | — | 88 | — | 6,106 | 6,106 | ||||||||||||||||||
| Class R-5 | 182 | — | 182 | — | 8,087 | 8,087 | ||||||||||||||||||
| Class R-6 | 22,429 | — | 22,429 | — | 589,722 | 589,722 | ||||||||||||||||||
| Total | $ | 29,919 | $ | — | $ | 29,919 | $ | — | $ | 2,477,948 | $ | 2,477,948 | ||||||||||||
7. Fees and transactions with related parties
CRMC, the fund’s investment adviser, is the parent company of American Funds Distributors®,
Inc. (“AFD”), the principal underwriter of the fund’s shares, and American Funds Service Company® (“AFS”),
the fund’s transfer agent. CRMC, AFD and AFS are considered related parties to the fund.
Investment advisory services — The fund has an investment advisory and service agreement
with CRMC that provides for monthly fees accrued daily. These fees are based on a series of decreasing annual rates beginning
with 0.580% on the first $500 million of daily net assets and decreasing to 0.340% on such assets in excess of $34 billion. For
the year ended November 30, 2023, the investment advisory services fees were $101,010,000, which were equivalent to an annualized
rate of 0.372% of average daily net assets.
Class-specific fees and expenses — Expenses that are specific to individual share classes
are accrued directly to the respective share class. The principal class-specific fees and expenses are further described below:
Distribution services — The fund has plans of distribution for all share classes, except
Class F-2, F-3, 529-F-2, 529-F-3, R-5E, R-5 and R-6 shares. Under the plans, the board of trustees approves certain categories
of expenses that are used to finance activities primarily intended to sell fund shares and service existing accounts. The plans
provide for payments, based on an annualized percentage of average daily net assets, ranging from 0.25% to 1.00% as noted in this
section. In some cases, the board of trustees has limited the amounts that may be paid to less than the maximum allowed by the
plans. All share classes with a plan may use up to 0.25% of average daily net assets to pay service fees, or to compensate AFD
for paying service fees, to firms that have entered into agreements with AFD to provide certain shareholder services. The remaining
amounts available to be paid under each plan are paid to dealers to compensate them for their sales activities.
| Share class | Currently approved limits | Plan limits | ||||||
| Class A | 0.25 | % | 0.25 | % | ||||
| Class 529-A | 0.25 | 0.50 | ||||||
| Classes C, 529-C and R-1 | 1.00 | 1.00 | ||||||
| Class R-2 | 0.75 | 1.00 | ||||||
| Class R-2E | 0.60 | 0.85 | ||||||
| Classes 529-E and R-3 | 0.50 | 0.75 | ||||||
| Classes T, F-1, 529-T, 529-F-1 and R-4 | 0.25 | 0.50 | ||||||
For Class A and 529-A shares, distribution-related expenses include the reimbursement of dealer and wholesaler
commissions paid by AFD for certain shares sold without a sales charge. These share classes reimburse AFD for amounts billed within
the prior 15 months but only to the extent that the overall annual expense limits are not exceeded. As of November 30, 2023, there
were no unreimbursed expenses subject to reimbursement for Class A or 529-A shares.
Transfer agent services — The fund has a shareholder services agreement with AFS under which
the fund compensates AFS for providing transfer agent services to each of the fund’s share classes. These services include
recordkeeping, shareholder communications and transaction processing. In addition, the fund reimburses AFS for amounts paid to
third parties for performing transfer agent services on behalf of fund shareholders.
Administrative services — The fund has an administrative services agreement with CRMC under
which the fund compensates CRMC for providing administrative services to all share classes. Administrative services are provided
by CRMC and its affiliates to help assist third parties providing non-distribution services to fund shareholders. These services
include providing in-depth information on the fund and market developments that impact fund investments. Administrative services
also include, but are not limited to, coordinating, monitoring and overseeing third parties that provide services to fund shareholders.
The agreement provides the fund the ability to charge an administrative services fee at the annual rate of 0.05% of the average
daily net assets attributable to each share class of the fund. Currently the fund pays CRMC an administrative services fee at
the annual rate of 0.03% of the average daily net assets attributable to each share class of the fund for CRMC’s provision
of administrative services.
529 plan services — Each 529 share class is subject to service fees to compensate the Virginia
College Savings Plan (“Virginia529”) for its oversight and administration of the CollegeAmerica 529 college savings
plan. The fees are based on the combined net assets invested in Class 529 and ABLE shares of the American Funds. Class ABLE shares
are offered on other American Funds by Virginia529 through ABLEAmerica®, a tax-advantaged savings program for individuals
with disabilities. Virginia529 is not considered a related party to the fund.
The quarterly fees are based on a series of decreasing annual rates beginning with 0.09% on the first
$20 billion of the combined net assets invested in the American Funds and decreasing to 0.03% on such assets in excess of $75
billion. The fees for any given calendar quarter are accrued and calculated on the basis of the average net assets of Class 529
and ABLE shares of the American Funds for the last month of the prior calendar quarter. For the year ended November 30, 2023,
the 529 plan services fees were $579,000, which were equivalent to 0.060% of the average daily net assets of each 529 share class.
For the year ended November 30, 2023, class-specific expenses under the agreements were as follows (dollars
in thousands):
| Share class | Distribution services |
Transfer agent services |
Administrative services |
529 plan services |
||||||||||||
| Class A | $31,911 | $15,854 | $4,026 | Not applicable | ||||||||||||
| Class C | 2,922 | 351 | 88 | Not applicable | ||||||||||||
| Class T | — | — | * | — | * | Not applicable | ||||||||||
| Class F-1 | 525 | 320 | 64 | Not applicable | ||||||||||||
| Class F-2 | Not applicable | 2,437 | 699 | Not applicable | ||||||||||||
| Class F-3 | Not applicable | 6 | 320 | Not applicable | ||||||||||||
| Class 529-A | 1,808 | 898 | 247 | $491 | ||||||||||||
| Class 529-C | 272 | 30 | 8 | 16 | ||||||||||||
| Class 529-E | 150 | 20 | 9 | 18 | ||||||||||||
| Class 529-T | — | — | * | — | * | — | * | |||||||||
| Class 529-F-1 | — | — | * | — | * | — | * | |||||||||
| Class 529-F-2 | Not applicable | 34 | 27 | 54 | ||||||||||||
| Class 529-F-3 | Not applicable | — | * | — | * | — | * | |||||||||
| Class R-1 | 265 | 25 | 8 | Not applicable | ||||||||||||
| Class R-2 | 1,277 | 581 | 51 | Not applicable | ||||||||||||
| Class R-2E | 72 | 24 | 4 | Not applicable | ||||||||||||
| Class R-3 | 1,203 | 358 | 72 | Not applicable | ||||||||||||
| Class R-4 | 586 | 233 | 70 | Not applicable | ||||||||||||
| Class R-5E | Not applicable | 104 | 21 | Not applicable | ||||||||||||
| Class R-5 | Not applicable | 38 | 23 | Not applicable | ||||||||||||
| Class R-6 | Not applicable | 46 | 2,411 | Not applicable | ||||||||||||
| Total class-specific expenses | $40,991 | $21,359 | $8,148 | $579 | ||||||||||||
| * | Amount less than one thousand. |
Trustees’ deferred compensation — Trustees who are unaffiliated with CRMC may elect
to defer the cash payment of part or all of their compensation. These deferred amounts, which remain as liabilities of the fund,
are treated as if invested in shares of the fund or other American Funds. These amounts represent general, unsecured liabilities
of the fund and vary according to the total returns of the selected funds. Trustees’ compensation of $353,000 in the fund’s
statement of operations reflects $162,000 in current fees (either paid in cash or deferred) and a net increase of $191,000 in
the value of the deferred amounts.
Affiliated officers and trustees — Officers
and certain trustees of the fund are or may be considered to be affiliated with CRMC, AFD and AFS. No affiliated officers or
trustees received any compensation directly from the fund.
Investment in CCF — The fund holds shares of CCF, an institutional prime money market fund
managed by CRMC. CCF invests in high-quality, short-term money market instruments. CCF is used as the primary investment vehicle
for the fund’s short-term instruments. CCF shares are only available for purchase by CRMC, its affiliates, and other funds
managed by CRMC or its affiliates, and are not available to the public. CRMC does not receive an investment advisory services
fee from CCF.
Security transactions with related funds — The fund purchased investment securities from,
and sold investment securities to, other funds managed by CRMC (or funds managed by certain affiliates of CRMC) under procedures
adopted by the fund’s board of trustees. The funds involved in such transactions are considered related by virtue of having
a common investment adviser (or affiliated investment advisers), common trustees and/or common officers. Each transaction was
executed at the current market price of the security and no brokerage commissions or fees were paid in accordance with Rule 17a-7
of the 1940 Act. During the year ended November 30, 2023, the fund engaged in such purchase and sale transactions with related
funds in the amounts of $298,959,000 and $282,728,000, respectively, which generated $2,800,000 of net realized gains from such
sales.
Interfund lending — Pursuant to an exemptive order issued by the SEC, the fund, along with
other CRMC-managed funds (or funds managed by certain affiliates of CRMC), may participate in an interfund lending program. The
program provides an alternate credit facility that permits the funds to lend or borrow cash for temporary purposes directly to
or from one another, subject to the conditions of the exemptive order. The fund borrowed $10,000 at a rate of 5.860% from one
or more CRMC-managed funds during the year ended November 30, 2023. The fund paid less than $1,000 in interest expense for the
loan.
8. Indemnifications
The fund’s organizational documents provide board members and officers with indemnification against
certain liabilities or expenses in connection with the performance of their duties to the fund. In the normal course of business,
the fund may also enter into contracts that provide general indemnifications. The fund’s maximum exposure under these arrangements
is unknown since it is dependent on future claims that may be made against the fund. The risk of material loss from such claims
is considered remote. Insurance policies are also available to the fund’s board members and officers.
9. Capital share transactions
Capital share transactions in the fund were as follows (dollars and shares in thousands):
| Sales* | Reinvestments of distributions |
Repurchases* | Net (decrease) increase |
|||||||||||||||||||||||||||||
| Share class | Amount | Shares | Amount | Shares | Amount | Shares | Amount | Shares | ||||||||||||||||||||||||
| Year ended November 30, 2023 | ||||||||||||||||||||||||||||||||
| Class A | $ | 685,423 | 14,106 | $ | — | — | $ | (1,458,452 | ) | (30,190 | ) | $ | (773,029 | ) | (16,084 | ) | ||||||||||||||||
| Class C | 28,217 | 691 | — | † | — | † | (96,554 | ) | (2,368 | ) | (68,337 | ) | (1,677 | ) | ||||||||||||||||||
| Class T | — | — | — | — | — | — | — | — | ||||||||||||||||||||||||
| Class F-1 | 10,613 | 216 | — | — | (39,618 | ) | (809 | ) | (29,005 | ) | (593 | ) | ||||||||||||||||||||
| Class F-2 | 521,650 | 10,632 | 3,886 | 86 | (492,943 | ) | (10,150 | ) | 32,593 | 568 | ||||||||||||||||||||||
| Class F-3 | 197,967 | 4,053 | 3,022 | 66 | (224,404 | ) | (4,590 | ) | (23,415 | ) | (471 | ) | ||||||||||||||||||||
| Class 529-A | 70,390 | 1,468 | — | — | (113,871 | ) | (2,374 | ) | (43,481 | ) | (906 | ) | ||||||||||||||||||||
| Class 529-C | 4,640 | 112 | — | — | (12,396 | ) | (300 | ) | (7,756 | ) | (188 | ) | ||||||||||||||||||||
| Class 529-E | 2,021 | 43 | — | — | (4,794 | ) | (101 | ) | (2,773 | ) | (58 | ) | ||||||||||||||||||||
| Class 529-T | — | — | — | † | — | † | — | — | — | † | — | † | ||||||||||||||||||||
| Class 529-F-1 | — | — | — | † | — | † | — | — | — | † | — | † | ||||||||||||||||||||
| Class 529-F-2 | 17,779 | 367 | 156 | 3 | (12,936 | ) | (265 | ) | 4,999 | 105 | ||||||||||||||||||||||
| Class 529-F-3 | — | — | — | † | — | † | — | — | — | † | — | † | ||||||||||||||||||||
| Class R-1 | 2,728 | 64 | — | — | (6,004 | ) | (140 | ) | (3,276 | ) | (76 | ) | ||||||||||||||||||||
| Class R-2 | 29,870 | 694 | — | — | (38,935 | ) | (909 | ) | (9,065 | ) | (215 | ) | ||||||||||||||||||||
| Class R-2E | 3,010 | 65 | — | — | (2,027 | ) | (46 | ) | 983 | 19 | ||||||||||||||||||||||
| Class R-3 | 40,123 | 857 | — | — | (57,863 | ) | (1,243 | ) | (17,740 | ) | (386 | ) | ||||||||||||||||||||
| Class R-4 | 28,463 | 588 | — | — | (52,594 | ) | (1,101 | ) | (24,131 | ) | (513 | ) | ||||||||||||||||||||
| Class R-5E | 11,006 | 228 | 88 | 2 | (11,157 | ) | (231 | ) | (63 | ) | (1 | ) | ||||||||||||||||||||
| Class R-5 | 8,632 | 175 | 182 | 4 | (16,899 | ) | (343 | ) | (8,085 | ) | (164 | ) | ||||||||||||||||||||
| Class R-6 | 573,961 | 11,913 | 22,225 | 490 | (306,010 | ) | (6,118 | ) | 290,176 | 6,285 | ||||||||||||||||||||||
| Total net increase (decrease) | $ | 2,236,493 | 46,272 | $ | 29,559 | 651 | $ | (2,947,457 | ) | (61,278 | ) | $ | (681,405 | ) | (14,355 | ) | ||||||||||||||||
Refer to the end of the table for footnotes.
| Sales* | Reinvestments of distributions |
Repurchases* | Net increase (decrease) |
|||||||||||||||||||||||||||||
| Share class | Amount | Shares | Amount | Shares | Amount | Shares | Amount | Shares | ||||||||||||||||||||||||
| Year ended November 30, 2022 | ||||||||||||||||||||||||||||||||
| Class A | $ | 954,283 | 19,259 | $ | 1,301,048 | 21,406 | $ | (1,983,512 | ) | (40,441 | ) | $ | 271,819 | 224 | ||||||||||||||||||
| Class C | 38,271 | 911 | 44,071 | 853 | (135,903 | ) | (3,229 | ) | (53,561 | ) | (1,465 | ) | ||||||||||||||||||||
| Class T | — | — | — | — | — | — | — | — | ||||||||||||||||||||||||
| Class F-1 | 14,399 | 285 | 24,118 | 396 | (62,159 | ) | (1,238 | ) | (23,642 | ) | (557 | ) | ||||||||||||||||||||
| Class F-2 | 573,556 | 11,617 | 209,163 | 3,441 | (658,905 | ) | (13,455 | ) | 123,814 | 1,603 | ||||||||||||||||||||||
| Class F-3 | 267,533 | 5,370 | 94,146 | 1,542 | (258,556 | ) | (5,254 | ) | 103,123 | 1,658 | ||||||||||||||||||||||
| Class 529-A | 82,696 | 1,666 | 80,222 | 1,338 | (124,906 | ) | (2,534 | ) | 38,012 | 470 | ||||||||||||||||||||||
| Class 529-C | 5,891 | 135 | 4,214 | 80 | (16,416 | ) | (377 | ) | (6,311 | ) | (162 | ) | ||||||||||||||||||||
| Class 529-E | 2,297 | 48 | 3,138 | 54 | (5,105 | ) | (104 | ) | 330 | (2 | ) | |||||||||||||||||||||
| Class 529-T | — | — | 2 | — | † | — | — | 2 | — | † | ||||||||||||||||||||||
| Class 529-F-1 | — | — | 1 | — | † | — | — | 1 | — | † | ||||||||||||||||||||||
| Class 529-F-2 | 16,268 | 327 | 7,663 | 126 | (13,905 | ) | (281 | ) | 10,026 | 172 | ||||||||||||||||||||||
| Class 529-F-3 | — | — | 1 | — | † | — | — | 1 | — | † | ||||||||||||||||||||||
| Class R-1 | 4,330 | 100 | 3,164 | 59 | (7,869 | ) | (179 | ) | (375 | ) | (20 | ) | ||||||||||||||||||||
| Class R-2 | 33,182 | 758 | 19,349 | 356 | (51,602 | ) | (1,176 | ) | 929 | (62 | ) | |||||||||||||||||||||
| Class R-2E | 3,944 | 85 | 1,090 | 19 | (3,724 | ) | (80 | ) | 1,310 | 24 | ||||||||||||||||||||||
| Class R-3 | 47,870 | 1,001 | 24,813 | 423 | (67,848 | ) | (1,416 | ) | 4,835 | 8 | ||||||||||||||||||||||
| Class R-4 | 36,678 | 751 | 24,668 | 411 | (62,950 | ) | (1,269 | ) | (1,604 | ) | (107 | ) | ||||||||||||||||||||
| Class R-5E | 12,023 | 244 | 6,106 | 101 | (11,539 | ) | (235 | ) | 6,590 | 110 | ||||||||||||||||||||||
| Class R-5 | 9,741 | 195 | 8,084 | 131 | (23,149 | ) | (462 | ) | (5,324 | ) | (136 | ) | ||||||||||||||||||||
| Class R-6 | 1,477,001 | 29,180 | 584,760 | 9,567 | (272,803 | ) | (5,785 | ) | 1,788,958 | 32,962 | ||||||||||||||||||||||
| Total net increase (decrease) | $ | 3,579,963 | 71,932 | $ | 2,439,821 | 40,303 | $ | (3,760,851 | ) | (77,515 | ) | $ | 2,258,933 | 34,720 | ||||||||||||||||||
| * | Includes exchanges between share classes of the fund. |
| † | Amount less than one thousand. |
10. Investment transactions
The fund engaged in purchases and sales of investment securities, excluding short-term securities and
U.S. government obligations, if any, of $10,848,242,000 and $9,846,746,000, respectively, during the year ended November 30, 2023.
Financial highlights
| Income (loss) from investment operations1 |
Dividends and distributions | |||||||||||||||||||||||||||||||||||||||||||||||||||
| Year ended | Net asset value, beginning of year |
Net investment income (loss) |
Net gains (losses) on securities (both realized and unrealized) |
Total from investment operations |
Dividends (from net investment income) |
Distributions (from capital gains) |
Total dividends and distributions |
Net asset value, end of year |
Total return2,3 | Net assets, end of year (in millions) |
Ratio of expenses to average net assets before waivers/ reimburse- ments4 |
Ratio of expenses to average net assets after waivers/ reimburse- ments3,4 |
Ratio of net income (loss) to average net assets3 |
|||||||||||||||||||||||||||||||||||||||
| Class A: | ||||||||||||||||||||||||||||||||||||||||||||||||||||
| 11/30/2023 | $ | 45.55 | $ | .23 | $ | 7.50 | $ | 7.73 | $ | — | $ | — | $ | — | $ | 53.28 | 16.97 | % | $ | 14,299 | .77 | % | .77 | % | .47 | % | ||||||||||||||||||||||||||
| 11/30/2022 | 65.43 | .08 | (15.29 | ) | (15.21 | ) | — | (4.67 | ) | (4.67 | ) | 45.55 | (25.03 | ) | 12,957 | .75 | .75 | .16 | ||||||||||||||||||||||||||||||||||
| 11/30/2021 | 57.74 | (.12 | ) | 9.28 | 9.16 | (.01 | ) | (1.46 | ) | (1.47 | ) | 65.43 | 16.18 | 18,597 | .74 | .74 | (.20 | ) | ||||||||||||||||||||||||||||||||||
| 11/30/2020 | 47.60 | .10 | 13.40 | 13.50 | (.15 | ) | (3.21 | ) | (3.36 | ) | 57.74 | 30.27 | 16,314 | .77 | .77 | .21 | ||||||||||||||||||||||||||||||||||||
| 11/30/2019 | 45.74 | .23 | 5.52 | 5.75 | (.24 | ) | (3.65 | ) | (3.89 | ) | 47.60 | 14.56 | 13,160 | .78 | .78 | .51 | ||||||||||||||||||||||||||||||||||||
| Class C: | ||||||||||||||||||||||||||||||||||||||||||||||||||||
| 11/30/2023 | 38.45 | (.11 | ) | 6.29 | 6.18 | — | — | — | 44.63 | 16.07 | 287 | 1.52 | 1.52 | (.28 | ) | |||||||||||||||||||||||||||||||||||||
| 11/30/2022 | 56.34 | (.25 | ) | (12.97 | ) | (13.22 | ) | — | (4.67 | ) | (4.67 | ) | 38.45 | (25.58 | ) | 312 | 1.51 | 1.51 | (.61 | ) | ||||||||||||||||||||||||||||||||
| 11/30/2021 | 50.27 | (.51 | ) | 8.04 | 7.53 | — | (1.46 | ) | (1.46 | ) | 56.34 | 15.30 | 539 | 1.49 | 1.49 | (.94 | ) | |||||||||||||||||||||||||||||||||||
| 11/30/2020 | 42.01 | (.21 | ) | 11.68 | 11.47 | — | (3.21 | ) | (3.21 | ) | 50.27 | 29.30 | 544 | 1.51 | 1.51 | (.50 | ) | |||||||||||||||||||||||||||||||||||
| 11/30/2019 | 40.90 | (.10 | ) | 4.86 | 4.76 | — | (3.65 | ) | (3.65 | ) | 42.01 | 13.69 | 531 | 1.55 | 1.55 | (.25 | ) | |||||||||||||||||||||||||||||||||||
| Class T: | ||||||||||||||||||||||||||||||||||||||||||||||||||||
| 11/30/2023 | 45.75 | .37 | 7.53 | 7.90 | (.10 | ) | — | (.10 | ) | 53.55 | 17.30 | 5 | — | 6 | .49 | 5 | .49 | 5 | .75 | 5 | ||||||||||||||||||||||||||||||||
| 11/30/2022 | 65.54 | .20 | (15.32 | ) | (15.12 | ) | — | (4.67 | ) | (4.67 | ) | 45.75 | (24.84 | )5 | — | 6 | .50 | 5 | .50 | 5 | .41 | 5 | ||||||||||||||||||||||||||||||
| 11/30/2021 | 57.82 | .02 | 9.29 | 9.31 | (.13 | ) | (1.46 | ) | (1.59 | ) | 65.54 | 16.44 | 5 | — | 6 | .51 | 5 | .51 | 5 | .03 | 5 | |||||||||||||||||||||||||||||||
| 11/30/2020 | 47.66 | .21 | 13.41 | 13.62 | (.25 | ) | (3.21 | ) | (3.46 | ) | 57.82 | 30.57 | 5 | — | 6 | .53 | 5 | .53 | 5 | .44 | 5 | |||||||||||||||||||||||||||||||
| 11/30/2019 | 45.80 | .33 | 5.51 | 5.84 | (.33 | ) | (3.65 | ) | (3.98 | ) | 47.66 | 14.83 | 5 | — | 6 | .54 | 5 | .54 | 5 | .75 | 5 | |||||||||||||||||||||||||||||||
| Class F-1: | ||||||||||||||||||||||||||||||||||||||||||||||||||||
| 11/30/2023 | 45.70 | .21 | 7.52 | 7.73 | — | — | — | 53.43 | 16.92 | 219 | .81 | .81 | .44 | |||||||||||||||||||||||||||||||||||||||
| 11/30/2022 | 65.65 | .05 | (15.33 | ) | (15.28 | ) | — | (4.67 | ) | (4.67 | ) | 45.70 | (25.06 | ) | 215 | .80 | .80 | .11 | ||||||||||||||||||||||||||||||||||
| 11/30/2021 | 57.95 | (.15 | ) | 9.31 | 9.16 | — | (1.46 | ) | (1.46 | ) | 65.65 | 16.12 | 345 | .79 | .79 | (.24 | ) | |||||||||||||||||||||||||||||||||||
| 11/30/2020 | 47.76 | .09 | 13.44 | 13.53 | (.13 | ) | (3.21 | ) | (3.34 | ) | 57.95 | 30.21 | 363 | .80 | .80 | .19 | ||||||||||||||||||||||||||||||||||||
| 11/30/2019 | 45.85 | .21 | 5.54 | 5.75 | (.19 | ) | (3.65 | ) | (3.84 | ) | 47.76 | 14.50 | 329 | .83 | .83 | .47 | ||||||||||||||||||||||||||||||||||||
| Class F-2: | ||||||||||||||||||||||||||||||||||||||||||||||||||||
| 11/30/2023 | 45.66 | .35 | 7.51 | 7.86 | (.08 | ) | — | (.08 | ) | 53.44 | 17.26 | 2,587 | .52 | .52 | .72 | |||||||||||||||||||||||||||||||||||||
| 11/30/2022 | 65.43 | .19 | (15.29 | ) | (15.10 | ) | — | (4.67 | ) | (4.67 | ) | 45.66 | (24.84 | ) | 2,184 | .52 | .52 | .40 | ||||||||||||||||||||||||||||||||||
| 11/30/2021 | 57.73 | .02 | 9.28 | 9.30 | (.14 | ) | (1.46 | ) | (1.60 | ) | 65.43 | 16.43 | 3,025 | .51 | .51 | .03 | ||||||||||||||||||||||||||||||||||||
| 11/30/2020 | 47.58 | .20 | 13.41 | 13.61 | (.25 | ) | (3.21 | ) | (3.46 | ) | 57.73 | 30.58 | 2,439 | .52 | .52 | .41 | ||||||||||||||||||||||||||||||||||||
| 11/30/2019 | 45.75 | .33 | 5.50 | 5.83 | (.35 | ) | (3.65 | ) | (4.00 | ) | 47.58 | 14.81 | 1,586 | .55 | .55 | .75 | ||||||||||||||||||||||||||||||||||||
| Class F-3: | ||||||||||||||||||||||||||||||||||||||||||||||||||||
| 11/30/2023 | 45.89 | .41 | 7.54 | 7.95 | (.14 | ) | — | (.14 | ) | 53.70 | 17.38 | 1,153 | .41 | .41 | .83 | |||||||||||||||||||||||||||||||||||||
| 11/30/2022 | 65.66 | .25 | (15.35 | ) | (15.10 | ) | — | (4.67 | ) | (4.67 | ) | 45.89 | (24.76 | ) | 1,007 | .41 | .41 | .51 | ||||||||||||||||||||||||||||||||||
| 11/30/2021 | 57.91 | .08 | 9.30 | 9.38 | (.17 | ) | (1.46 | ) | (1.63 | ) | 65.66 | 16.55 | 1,332 | .41 | .41 | .13 | ||||||||||||||||||||||||||||||||||||
| 11/30/2020 | 47.72 | .25 | 13.44 | 13.69 | (.29 | ) | (3.21 | ) | (3.50 | ) | 57.91 | 30.73 | 1,004 | .44 | .43 | .52 | ||||||||||||||||||||||||||||||||||||
| 11/30/2019 | 45.87 | .37 | 5.52 | 5.89 | (.39 | ) | (3.65 | ) | (4.04 | ) | 47.72 | 14.93 | 705 | .45 | .45 | .84 | ||||||||||||||||||||||||||||||||||||
| Class 529-A: | ||||||||||||||||||||||||||||||||||||||||||||||||||||
| 11/30/2023 | 44.91 | .21 | 7.39 | 7.60 | — | — | — | 52.51 | 16.92 | 879 | .80 | .80 | .44 | |||||||||||||||||||||||||||||||||||||||
| 11/30/2022 | 64.58 | .06 | (15.06 | ) | (15.00 | ) | — | (4.67 | ) | (4.67 | ) | 44.91 | (25.04 | ) | 792 | .78 | .78 | .13 | ||||||||||||||||||||||||||||||||||
| 11/30/2021 | 57.02 | (.14 | ) | 9.17 | 9.03 | (.01 | ) | (1.46 | ) | (1.47 | ) | 64.58 | 16.13 | 1,109 | .77 | .77 | (.22 | ) | ||||||||||||||||||||||||||||||||||
| 11/30/2020 | 47.05 | .08 | 13.23 | 13.31 | (.13 | ) | (3.21 | ) | (3.34 | ) | 57.02 | 30.23 | 956 | .80 | .80 | .16 | ||||||||||||||||||||||||||||||||||||
| 11/30/2019 | 45.25 | .20 | 5.46 | 5.66 | (.21 | ) | (3.65 | ) | (3.86 | ) | 47.05 | 14.51 | 694 | .83 | .83 | .46 | ||||||||||||||||||||||||||||||||||||
Refer to the end of the table for footnotes.
Financial highlights (continued)
| Income (loss) from investment operations1 |
Dividends and distributions | |||||||||||||||||||||||||||||||||||||||||||||||||||
| Year ended | Net asset value, beginning of year |
Net investment income (loss) |
Net gains (losses) on securities (both realized and unrealized) |
Total from investment operations |
Dividends (from net investment income) |
Distributions (from capital gains) |
Total dividends and distributions |
Net asset value, end of year |
Total return2,3 | Net assets, end of year (in millions) |
Ratio of expenses to average net assets before waivers/ reimburse- ments4 |
Ratio of expenses to average net assets after waivers/ reimburse- ments3,4 |
Ratio of net income (loss) to average net assets3 |
|||||||||||||||||||||||||||||||||||||||
| Class 529-C: | ||||||||||||||||||||||||||||||||||||||||||||||||||||
| 11/30/2023 | $ | 39.06 | $ | (.14 | ) | $ | 6.40 | $ | 6.26 | $ | — | $ | — | $ | — | $ | 45.32 | 16.00 | % | $ | 26 | 1.58 | % | 1.58 | % | (.34 | )% | |||||||||||||||||||||||||
| 11/30/2022 | 57.20 | (.28 | ) | (13.19 | ) | (13.47 | ) | — | (4.67 | ) | (4.67 | ) | 39.06 | (25.62 | ) | 30 | 1.56 | 1.56 | (.66 | ) | ||||||||||||||||||||||||||||||||
| 11/30/2021 | 51.04 | (.54 | ) | 8.16 | 7.62 | — | (1.46 | ) | (1.46 | ) | 57.20 | 15.26 | 53 | 1.52 | 1.52 | (.98 | ) | |||||||||||||||||||||||||||||||||||
| 11/30/2020 | 42.62 | (.18 | ) | 11.81 | 11.63 | — | (3.21 | ) | (3.21 | ) | 51.04 | 29.25 | 57 | 1.56 | 1.56 | (.43 | ) | |||||||||||||||||||||||||||||||||||
| 11/30/2019 | 41.45 | (.12 | ) | 4.94 | 4.82 | — | (3.65 | ) | (3.65 | ) | 42.62 | 13.62 | 106 | 1.59 | 1.59 | (.30 | ) | |||||||||||||||||||||||||||||||||||
| Class 529-E: | ||||||||||||||||||||||||||||||||||||||||||||||||||||
| 11/30/2023 | 43.75 | .10 | 7.19 | 7.29 | — | — | — | 51.04 | 16.66 | 31 | 1.04 | 1.04 | .20 | |||||||||||||||||||||||||||||||||||||||
| 11/30/2022 | 63.19 | (.05 | ) | (14.72 | ) | (14.77 | ) | — | (4.67 | ) | (4.67 | ) | 43.75 | (25.23 | ) | 30 | 1.02 | 1.02 | (.11 | ) | ||||||||||||||||||||||||||||||||
| 11/30/2021 | 55.95 | (.28 | ) | 8.98 | 8.70 | — | (1.46 | ) | (1.46 | ) | 63.19 | 15.85 | 43 | 1.01 | 1.01 | (.46 | ) | |||||||||||||||||||||||||||||||||||
| 11/30/2020 | 46.24 | (.02 | ) | 12.97 | 12.95 | (.03 | ) | (3.21 | ) | (3.24 | ) | 55.95 | 29.89 | 38 | 1.03 | 1.03 | (.05 | ) | ||||||||||||||||||||||||||||||||||
| 11/30/2019 | 44.52 | .10 | 5.37 | 5.47 | (.10 | ) | (3.65 | ) | (3.75 | ) | 46.24 | 14.24 | 31 | 1.07 | 1.07 | .23 | ||||||||||||||||||||||||||||||||||||
| Class 529-T: | ||||||||||||||||||||||||||||||||||||||||||||||||||||
| 11/30/2023 | 45.69 | .34 | 7.52 | 7.86 | (.07 | ) | — | (.07 | ) | 53.48 | 17.23 | 5 | — | 6 | .54 | 5 | .54 | 5 | .70 | 5 | ||||||||||||||||||||||||||||||||
| 11/30/2022 | 65.49 | .18 | (15.31 | ) | (15.13 | ) | — | (4.67 | ) | (4.67 | ) | 45.69 | (24.88 | )5 | — | 6 | .55 | 5 | .55 | 5 | .36 | 5 | ||||||||||||||||||||||||||||||
| 11/30/2021 | 57.79 | (.02 | ) | 9.28 | 9.26 | (.10 | ) | (1.46 | ) | (1.56 | ) | 65.49 | 16.37 | 5 | — | 6 | .57 | 5 | .57 | 5 | (.02 | )5 | ||||||||||||||||||||||||||||||
| 11/30/2020 | 47.64 | .19 | 13.40 | 13.59 | (.23 | ) | (3.21 | ) | (3.44 | ) | 57.79 | 30.50 | 5 | — | 6 | .58 | 5 | .58 | 5 | .39 | 5 | |||||||||||||||||||||||||||||||
| 11/30/2019 | 45.78 | .31 | 5.51 | 5.82 | (.31 | ) | (3.65 | ) | (3.96 | ) | 47.64 | 14.78 | 5 | — | 6 | .59 | 5 | .59 | 5 | .70 | 5 | |||||||||||||||||||||||||||||||
| Class 529-F-1: | ||||||||||||||||||||||||||||||||||||||||||||||||||||
| 11/30/2023 | 44.95 | .29 | 7.40 | 7.69 | (.04 | ) | — | (.04 | ) | 52.60 | 17.13 | 5 | — | 6 | .63 | 5 | .63 | 5 | .61 | 5 | ||||||||||||||||||||||||||||||||
| 11/30/2022 | 64.53 | .15 | (15.06 | ) | (14.91 | ) | — | (4.67 | ) | (4.67 | ) | 44.95 | (24.91 | )5 | — | 6 | .61 | 5 | .61 | 5 | .30 | 5 | ||||||||||||||||||||||||||||||
| 11/30/2021 | 57.05 | (.03 | ) | 9.15 | 9.12 | (.18 | ) | (1.46 | ) | (1.64 | ) | 64.53 | 16.34 | 5 | — | 6 | .59 | 5 | .59 | 5 | (.05 | )5 | ||||||||||||||||||||||||||||||
| 11/30/2020 | 47.04 | .21 | 13.23 | 13.44 | (.22 | ) | (3.21 | ) | (3.43 | ) | 57.05 | 30.58 | 5 | — | 6 | .58 | 5 | .58 | 5 | .46 | 5 | |||||||||||||||||||||||||||||||
| 11/30/2019 | 45.28 | .30 | 5.44 | 5.74 | (.33 | ) | (3.65 | ) | (3.98 | ) | 47.04 | 14.75 | 65 | .61 | .61 | .68 | ||||||||||||||||||||||||||||||||||||
| Class 529-F-2: | ||||||||||||||||||||||||||||||||||||||||||||||||||||
| 11/30/2023 | 45.67 | .36 | 7.52 | 7.88 | (.09 | ) | — | (.09 | ) | 53.46 | 17.28 | 102 | .51 | .51 | .73 | |||||||||||||||||||||||||||||||||||||
| 11/30/2022 | 65.45 | .19 | (15.30 | ) | (15.11 | ) | — | (4.67 | ) | (4.67 | ) | 45.67 | (24.86 | ) | 83 | .52 | .52 | .40 | ||||||||||||||||||||||||||||||||||
| 11/30/2021 | 57.74 | (.01 | ) | 9.29 | 9.28 | (.11 | ) | (1.46 | ) | (1.57 | ) | 65.45 | 16.39 | 107 | .55 | .55 | (.01 | ) | ||||||||||||||||||||||||||||||||||
| 11/30/20207,8 | 52.00 | (.01 | ) | 5.75 | 5.74 | — | — | — | 57.74 | 11.06 | 9 | 84 | .04 | 9 | .04 | 9 | (.01 | )9 | ||||||||||||||||||||||||||||||||||
| Class 529-F-3: | ||||||||||||||||||||||||||||||||||||||||||||||||||||
| 11/30/2023 | 45.67 | .37 | 7.51 | 7.88 | (.11 | ) | — | (.11 | ) | 53.44 | 17.30 | — | 6 | .48 | .48 | .75 | ||||||||||||||||||||||||||||||||||||
| 11/30/2022 | 65.41 | .22 | (15.29 | ) | (15.07 | ) | — | (4.67 | ) | (4.67 | ) | 45.67 | (24.81 | ) | — | 6 | .47 | .47 | .44 | |||||||||||||||||||||||||||||||||
| 11/30/2021 | 57.74 | .05 | 9.27 | 9.32 | (.19 | ) | (1.46 | ) | (1.65 | ) | 65.41 | 16.48 | — | 6 | .50 | .47 | .07 | |||||||||||||||||||||||||||||||||||
| 11/30/20207,8 | 52.00 | — | 10 | 5.74 | 5.74 | — | — | — | 57.74 | 11.06 | 9 | — | 6 | .06 | 9 | .04 | 9 | (.01 | )9 | |||||||||||||||||||||||||||||||||
| Class R-1: | ||||||||||||||||||||||||||||||||||||||||||||||||||||
| 11/30/2023 | 40.11 | (.11 | ) | 6.58 | 6.47 | — | — | — | 46.58 | 16.13 | 28 | 1.50 | 1.50 | (.25 | ) | |||||||||||||||||||||||||||||||||||||
| 11/30/2022 | 58.57 | (.25 | ) | (13.54 | ) | (13.79 | ) | — | (4.67 | ) | (4.67 | ) | 40.11 | (25.58 | ) | 27 | 1.49 | 1.49 | (.58 | ) | ||||||||||||||||||||||||||||||||
| 11/30/2021 | 52.21 | (.54 | ) | 8.36 | 7.82 | — | (1.46 | ) | (1.46 | ) | 58.57 | 15.28 | 40 | 1.50 | 1.50 | (.95 | ) | |||||||||||||||||||||||||||||||||||
| 11/30/2020 | 43.52 | (.23 | ) | 12.13 | 11.90 | — | (3.21 | ) | (3.21 | ) | 52.21 | 29.30 | 42 | 1.52 | 1.52 | (.52 | ) | |||||||||||||||||||||||||||||||||||
| 11/30/2019 | 42.22 | (.10 | ) | 5.05 | 4.95 | — | (3.65 | ) | (3.65 | ) | 43.52 | 13.68 | 39 | 1.55 | 1.55 | (.25 | ) | |||||||||||||||||||||||||||||||||||
Refer to the end of the table for footnotes.
Financial highlights (continued)
| Income (loss) from investment operations1 |
Dividends and distributions | |||||||||||||||||||||||||||||||||||||||||||||||||||
| Year ended | Net asset value, beginning of year |
Net investment income (loss) |
Net gains (losses) on securities (both realized and unrealized) |
Total from investment operations |
Dividends (from net investment income) |
Distributions (from capital gains) |
Total dividends and distributions |
Net asset value, end of year |
Total return2,3 | Net assets, end of year (in millions) |
Ratio of expenses to average net assets before waivers/ reimburse- ments4 |
Ratio of expenses to average net assets after waivers/ reimburse- ments3,4 |
Ratio of net income (loss) to average net assets3 |
|||||||||||||||||||||||||||||||||||||||
| Class R-2: | ||||||||||||||||||||||||||||||||||||||||||||||||||||
| 11/30/2023 | $ | 40.42 | $ | (.11 | ) | $ | 6.62 | $ | 6.51 | $ | — | $ | — | $ | — | $ | 46.93 | 16.10 | % | $ | 182 | 1.50 | % | 1.50 | % | (.26 | )% | |||||||||||||||||||||||||
| 11/30/2022 | 59.00 | (.27 | ) | (13.64 | ) | (13.91 | ) | — | (4.67 | ) | (4.67 | ) | 40.42 | (25.60 | ) | 165 | 1.53 | 1.53 | (.62 | ) | ||||||||||||||||||||||||||||||||
| 11/30/2021 | 52.59 | (.55 | ) | 8.42 | 7.87 | — | (1.46 | ) | (1.46 | ) | 59.00 | 15.29 | 244 | 1.50 | 1.50 | (.96 | ) | |||||||||||||||||||||||||||||||||||
| 11/30/2020 | 43.81 | (.23 | ) | 12.22 | 11.99 | — | (3.21 | ) | (3.21 | ) | 52.59 | 29.29 | 236 | 1.51 | 1.51 | (.52 | ) | |||||||||||||||||||||||||||||||||||
| 11/30/2019 | 42.47 | (.10 | ) | 5.09 | 4.99 | — | (3.65 | ) | (3.65 | ) | 43.81 | 13.70 | 203 | 1.55 | 1.55 | (.25 | ) | |||||||||||||||||||||||||||||||||||
| Class R-2E: | ||||||||||||||||||||||||||||||||||||||||||||||||||||
| 11/30/2023 | 43.91 | .01 | 7.22 | 7.23 | — | — | — | 51.14 | 16.47 | 14 | 1.21 | 1.21 | .03 | |||||||||||||||||||||||||||||||||||||||
| 11/30/2022 | 63.51 | (.15 | ) | (14.78 | ) | (14.93 | ) | — | (4.67 | ) | (4.67 | ) | 43.91 | (25.37 | ) | 11 | 1.22 | 1.22 | (.31 | ) | ||||||||||||||||||||||||||||||||
| 11/30/2021 | 56.34 | (.41 | ) | 9.04 | 8.63 | — | (1.46 | ) | (1.46 | ) | 63.51 | 15.61 | 15 | 1.21 | 1.21 | (.67 | ) | |||||||||||||||||||||||||||||||||||
| 11/30/2020 | 46.59 | (.11 | ) | 13.07 | 12.96 | — | (3.21 | ) | (3.21 | ) | 56.34 | 29.67 | 14 | 1.23 | 1.23 | (.23 | ) | |||||||||||||||||||||||||||||||||||
| 11/30/2019 | 44.88 | .02 | 5.41 | 5.43 | (.07 | ) | (3.65 | ) | (3.72 | ) | 46.59 | 14.02 | 13 | 1.25 | 1.25 | .04 | ||||||||||||||||||||||||||||||||||||
| Class R-3: | ||||||||||||||||||||||||||||||||||||||||||||||||||||
| 11/30/2023 | 43.85 | .08 | 7.21 | 7.29 | — | — | — | 51.14 | 16.62 | 254 | 1.06 | 1.06 | .18 | |||||||||||||||||||||||||||||||||||||||
| 11/30/2022 | 63.34 | (.07 | ) | (14.75 | ) | (14.82 | ) | — | (4.67 | ) | (4.67 | ) | 43.85 | (25.26 | ) | 235 | 1.07 | 1.07 | (.15 | ) | ||||||||||||||||||||||||||||||||
| 11/30/2021 | 56.10 | (.31 | ) | 9.01 | 8.70 | — | (1.46 | ) | (1.46 | ) | 63.34 | 15.80 | 339 | 1.06 | 1.06 | (.51 | ) | |||||||||||||||||||||||||||||||||||
| 11/30/2020 | 46.34 | (.03 | ) | 13.01 | 12.98 | (.01 | ) | (3.21 | ) | (3.22 | ) | 56.10 | 29.88 | 322 | 1.07 | 1.07 | (.07 | ) | ||||||||||||||||||||||||||||||||||
| 11/30/2019 | 44.58 | .09 | 5.38 | 5.47 | (.06 | ) | (3.65 | ) | (3.71 | ) | 46.34 | 14.20 | 303 | 1.10 | 1.10 | .20 | ||||||||||||||||||||||||||||||||||||
| Class R-4: | ||||||||||||||||||||||||||||||||||||||||||||||||||||
| 11/30/2023 | 45.01 | .23 | 7.42 | 7.65 | — | — | — | 52.66 | 16.97 | 247 | .76 | .76 | .48 | |||||||||||||||||||||||||||||||||||||||
| 11/30/2022 | 64.72 | .07 | (15.11 | ) | (15.04 | ) | — | (4.67 | ) | (4.67 | ) | 45.01 | (25.03 | ) | 234 | .76 | .76 | .15 | ||||||||||||||||||||||||||||||||||
| 11/30/2021 | 57.13 | (.13 | ) | 9.18 | 9.05 | — | (1.46 | ) | (1.46 | ) | 64.72 | 16.16 | 344 | .76 | .76 | (.21 | ) | |||||||||||||||||||||||||||||||||||
| 11/30/2020 | 47.11 | .11 | 13.24 | 13.35 | (.12 | ) | (3.21 | ) | (3.33 | ) | 57.13 | 30.26 | 344 | .77 | .77 | .23 | ||||||||||||||||||||||||||||||||||||
| 11/30/2019 | 45.29 | .22 | 5.46 | 5.68 | (.21 | ) | (3.65 | ) | (3.86 | ) | 47.11 | 14.54 | 332 | .80 | .80 | .51 | ||||||||||||||||||||||||||||||||||||
| Class R-5E: | ||||||||||||||||||||||||||||||||||||||||||||||||||||
| 11/30/2023 | 45.37 | .33 | 7.46 | 7.79 | (.06 | ) | — | (.06 | ) | 53.10 | 17.20 | 75 | .56 | .56 | .68 | |||||||||||||||||||||||||||||||||||||
| 11/30/2022 | 65.07 | .17 | (15.20 | ) | (15.03 | ) | — | (4.67 | ) | (4.67 | ) | 45.37 | (24.89 | ) | 64 | .57 | .57 | .35 | ||||||||||||||||||||||||||||||||||
| 11/30/2021 | 57.43 | (.01 | ) | 9.22 | 9.21 | (.11 | ) | (1.46 | ) | (1.57 | ) | 65.07 | 16.38 | 85 | .56 | .56 | (.02 | ) | ||||||||||||||||||||||||||||||||||
| 11/30/2020 | 47.39 | .19 | 13.33 | 13.52 | (.27 | ) | (3.21 | ) | (3.48 | ) | 57.43 | 30.53 | 71 | .56 | .56 | .41 | ||||||||||||||||||||||||||||||||||||
| 11/30/2019 | 45.59 | .26 | 5.53 | 5.79 | (.34 | ) | (3.65 | ) | (3.99 | ) | 47.39 | 14.79 | 55 | .57 | .57 | .59 | ||||||||||||||||||||||||||||||||||||
| Class R-5: | ||||||||||||||||||||||||||||||||||||||||||||||||||||
| 11/30/2023 | 46.14 | .38 | 7.59 | 7.97 | (.11 | ) | — | (.11 | ) | 54.00 | 17.33 | 78 | .46 | .46 | .78 | |||||||||||||||||||||||||||||||||||||
| 11/30/2022 | 66.03 | .22 | (15.44 | ) | (15.22 | ) | — | (4.67 | ) | (4.67 | ) | 46.14 | (24.80 | ) | 74 | .45 | .45 | .45 | ||||||||||||||||||||||||||||||||||
| 11/30/2021 | 58.23 | .06 | 9.35 | 9.41 | (.15 | ) | (1.46 | ) | (1.61 | ) | 66.03 | 16.51 | 115 | .45 | .45 | .10 | ||||||||||||||||||||||||||||||||||||
| 11/30/2020 | 47.96 | .27 | 13.48 | 13.75 | (.27 | ) | (3.21 | ) | (3.48 | ) | 58.23 | 30.66 | 123 | .47 | .47 | .56 | ||||||||||||||||||||||||||||||||||||
| 11/30/2019 | 46.07 | .36 | 5.54 | 5.90 | (.36 | ) | (3.65 | ) | (4.01 | ) | 47.96 | 14.88 | 126 | .49 | .49 | .81 | ||||||||||||||||||||||||||||||||||||
| Class R-6: | ||||||||||||||||||||||||||||||||||||||||||||||||||||
| 11/30/2023 | 45.95 | .41 | 7.55 | 7.96 | (.14 | ) | — | (.14 | ) | 53.77 | 17.40 | 8,875 | .41 | .41 | .83 | |||||||||||||||||||||||||||||||||||||
| 11/30/2022 | 65.75 | .25 | (15.38 | ) | (15.13 | ) | — | (4.67 | ) | (4.67 | ) | 45.95 | (24.77 | ) | 7,295 | .41 | .41 | .52 | ||||||||||||||||||||||||||||||||||
| 11/30/2021 | 57.99 | .08 | 9.32 | 9.40 | (.18 | ) | (1.46 | ) | (1.64 | ) | 65.75 | 16.55 | 8,271 | .41 | .41 | .13 | ||||||||||||||||||||||||||||||||||||
| 11/30/2020 | 47.78 | .24 | 13.47 | 13.71 | (.29 | ) | (3.21 | ) | (3.50 | ) | 57.99 | 30.74 | 6,336 | .42 | .42 | .50 | ||||||||||||||||||||||||||||||||||||
| 11/30/2019 | 45.92 | .38 | 5.52 | 5.90 | (.39 | ) | (3.65 | ) | (4.04 | ) | 47.78 | 14.94 | 3,834 | .44 | .44 | .85 | ||||||||||||||||||||||||||||||||||||
Refer to the end of the table for footnotes.
Financial highlights (continued)
| Year ended November 30, | ||||||||||
| 2023 | 2022 | 2021 | 2020 | 2019 | ||||||
| Portfolio turnover rate for all share classes11 | 39% | 35% | 28%12 | 38% | 39% | |||||
| 1 | Based on average shares outstanding. |
| 2 | Total returns exclude any applicable sales charges, including contingent deferred sales charges. |
| 3 | This column reflects the impact, if any, of certain waivers/reimbursements from AFS and/or CRMC. During one of the years shown, AFS waived a portion of transfer agent services fees for Class F-3 shares. In addition, during some of the years shown, CRMC reimbursed a portion of transfer agent services fees for Class 529-F-3 shares. |
| 4 | Ratios do not include expenses of any Central Funds. The fund indirectly bears its proportionate share of the expenses of any Central Funds. |
| 5 | All or a significant portion of assets in this class consisted of seed capital invested by CRMC and/or its affiliates. Fees for distribution services are not charged or accrued on these seed capital assets. If such fees were paid by the fund on seed capital assets, fund expenses would have been higher and net income and total return would have been lower. |
| 6 | Amount less than $1 million. |
| 7 | Based on operations for a period that is less than a full year. |
| 8 | Class 529-F-2 and 529-F-3 shares began investment operations on October 30, 2020. |
| 9 | Not annualized. |
| 10 | Amount less than $.01. |
| 11 | Rates do not include the fund’s portfolio activity with respect to any Central Funds. |
| 12 | Includes the value of securities sold due to redemptions of shares in-kind. The rate would have been 27% for the year ended November 30, 2021, if the value of securities sold due to in-kind redemptions were excluded. |
Refer to the notes to financial statements.
Report of Independent Registered Public Accounting Firm
To the Board of Trustees and Shareholders of The New Economy
Fund
Opinion on the Financial Statements
We have audited the accompanying statement of assets and liabilities,
including the investment portfolio, of The New Economy Fund (the “Fund”) as of November 30, 2023, the related statement
of operations for the year ended November 30, 2023, the statements of changes in net assets for each of the two years in the period
ended November 30, 2023, including the related notes, and the financial highlights for each of the periods indicated therein (collectively
referred to as the “financial statements”). In our opinion, the financial statements present fairly, in all material
respects, the financial position of the Fund as of November 30, 2023, the results of its operations for the year then ended, the
changes in its net assets for each of the two years in the period ended November 30, 2023 and the financial highlights for each
of the periods indicated therein in conformity with accounting principles generally accepted in the United States of America.
Basis for Opinion
These financial statements are the responsibility of the Fund’s
management. Our responsibility is to express an opinion on the Fund’s financial statements based on our audits. We are a
public accounting firm registered with the Public Company Accounting Oversight Board (United States) (PCAOB) and are required to
be independent with respect to the Fund in accordance with the U.S. federal securities laws and the applicable rules and regulations
of the Securities and Exchange Commission and the PCAOB.
We conducted our audits of these financial statements in accordance
with the standards of the PCAOB. Those standards require that we plan and perform the audit to obtain reasonable assurance about
whether the financial statements are free of material misstatement, whether due to error or fraud.
Our audits included performing procedures to assess the risks
of material misstatement of the financial statements, whether due to error or fraud, and performing procedures that respond to
those risks. Such procedures included examining, on a test basis, evidence regarding the amounts and disclosures in the financial
statements. Our audits also included evaluating the accounting principles used and significant estimates made by management, as
well as evaluating the overall presentation of the financial statements. Our procedures included confirmation of securities owned
as of November 30, 2023 by correspondence with the custodian, transfer agent and brokers; when replies were not received from brokers,
we performed other auditing procedures. We believe that our audits provide a reasonable basis for our opinion.
/s/ PricewaterhouseCoopers LLP
Los Angeles, California
January 9, 2024
We have served as the auditor of one or more investment companies
in The Capital Group Companies Investment Company Complex since 1934.
| Expense example | unaudited |
As a fund shareholder, you incur two types of costs: (1) transaction
costs, such as initial sales charges on purchase payments and contingent deferred sales charges on redemptions (loads), and (2)
ongoing costs, including management fees, distribution and service (12b-1) fees, and other expenses. This example is intended to
help you understand your ongoing costs (in dollars) of investing in the fund so you can compare these costs with the ongoing costs
of investing in other mutual funds. The example is based on an investment of $1,000 invested at the beginning of the period and
held for the entire six-month period (June 1, 2023, through November 30, 2023).
Actual expenses:
The first line of each share class in the table on the following
page provides information about actual account values and actual expenses. You may use the information in this line, together with
the amount you invested, to estimate the expenses that you paid over the period. Simply divide your account value by $1,000 (for
example, an $8,600 account value divided by $1,000 = 8.6), then multiply the result by the number in the first line under the heading
titled “Expenses paid during period” to estimate the expenses you paid on your account during this period.
Hypothetical example for comparison purposes:
The second line of each share class in the table on the following
page provides information about hypothetical account values and hypothetical expenses based on the actual expense ratio for the
share class and an assumed rate of return of 5.00% per year before expenses, which is not the actual return of the share class.
The hypothetical account values and expenses may not be used to estimate the actual ending account balance or expenses you paid
for the period. You may use this information to compare the ongoing costs of investing in the fund and other funds. To do so, compare
this 5.00% hypothetical example with the 5.00% hypothetical examples that appear in the shareholder reports of the other funds.
Notes:
Retirement plan participants may be subject to certain fees charged
by the plan sponsor, and Class F-1, F-2, F-3, 529-F-1, 529-F-2 and 529-F-3 shareholders may be subject to fees charged by financial
intermediaries, typically ranging from 0.75% to 1.50% of assets annually depending on services offered. You can estimate the impact
of these fees by adding the amount of the fees to the total estimated expenses you paid on your account during the period as calculated
above. In addition, your ending account value would be lower by the amount of these fees.
Note that the expenses shown in the table on the following page
are meant to highlight your ongoing costs only and do not reflect any transactional costs, such as sales charges (loads). Therefore,
the second line of each share class in the table is useful in comparing ongoing costs only and will not help you determine the
relative total costs of owning different funds. In addition, if these transactional costs were included, your costs would have
been higher.
Expense example
(continued)
| Beginning account value 6/1/2023 |
Ending account value 11/30/2023 |
Expenses paid during period* |
Annualized expense ratio |
|||||||||||||
| Class A – actual return | $ | 1,000.00 | $ | 1,088.03 | $ | 4.03 | .77 | % | ||||||||
| Class A – assumed 5% return | 1,000.00 | 1,021.21 | 3.90 | .77 | ||||||||||||
| Class C – actual return | 1,000.00 | 1,083.79 | 7.94 | 1.52 | ||||||||||||
| Class C – assumed 5% return | 1,000.00 | 1,017.45 | 7.69 | 1.52 | ||||||||||||
| Class T – actual return | 1,000.00 | 1,089.53 | 2.51 | .48 | ||||||||||||
| Class T – assumed 5% return | 1,000.00 | 1,022.66 | 2.43 | .48 | ||||||||||||
| Class F-1 – actual return | 1,000.00 | 1,087.73 | 4.24 | .81 | ||||||||||||
| Class F-1 – assumed 5% return | 1,000.00 | 1,021.01 | 4.10 | .81 | ||||||||||||
| Class F-2 – actual return | 1,000.00 | 1,089.48 | 2.67 | .51 | ||||||||||||
| Class F-2 – assumed 5% return | 1,000.00 | 1,022.51 | 2.59 | .51 | ||||||||||||
| Class F-3 – actual return | 1,000.00 | 1,089.90 | 2.15 | .41 | ||||||||||||
| Class F-3 – assumed 5% return | 1,000.00 | 1,023.01 | 2.08 | .41 | ||||||||||||
| Class 529-A – actual return | 1,000.00 | 1,087.85 | 4.13 | .79 | ||||||||||||
| Class 529-A – assumed 5% return | 1,000.00 | 1,021.11 | 4.00 | .79 | ||||||||||||
| Class 529-C – actual return | 1,000.00 | 1,083.42 | 8.25 | 1.58 | ||||||||||||
| Class 529-C – assumed 5% return | 1,000.00 | 1,017.15 | 7.99 | 1.58 | ||||||||||||
| Class 529-E – actual return | 1,000.00 | 1,086.64 | 5.39 | 1.03 | ||||||||||||
| Class 529-E – assumed 5% return | 1,000.00 | 1,019.90 | 5.22 | 1.03 | ||||||||||||
| Class 529-T – actual return | 1,000.00 | 1,089.23 | 2.83 | .54 | ||||||||||||
| Class 529-T – assumed 5% return | 1,000.00 | 1,022.36 | 2.74 | .54 | ||||||||||||
| Class 529-F-1 – actual return | 1,000.00 | 1,088.82 | 3.30 | .63 | ||||||||||||
| Class 529-F-1 – assumed 5% return | 1,000.00 | 1,021.91 | 3.19 | .63 | ||||||||||||
| Class 529-F-2 – actual return | 1,000.00 | 1,089.46 | 2.72 | .52 | ||||||||||||
| Class 529-F-2 – assumed 5% return | 1,000.00 | 1,022.46 | 2.64 | .52 | ||||||||||||
| Class 529-F-3 – actual return | 1,000.00 | 1,089.48 | 2.51 | .48 | ||||||||||||
| Class 529-F-3 – assumed 5% return | 1,000.00 | 1,022.66 | 2.43 | .48 | ||||||||||||
| Class R-1 – actual return | 1,000.00 | 1,084.24 | 7.84 | 1.50 | ||||||||||||
| Class R-1 – assumed 5% return | 1,000.00 | 1,017.55 | 7.59 | 1.50 | ||||||||||||
| Class R-2 – actual return | 1,000.00 | 1,084.08 | 7.84 | 1.50 | ||||||||||||
| Class R-2 – assumed 5% return | 1,000.00 | 1,017.55 | 7.59 | 1.50 | ||||||||||||
| Class R-2E – actual return | 1,000.00 | 1,085.75 | 6.27 | 1.20 | ||||||||||||
| Class R-2E – assumed 5% return | 1,000.00 | 1,019.05 | 6.07 | 1.20 | ||||||||||||
| Class R-3 – actual return | 1,000.00 | 1,086.47 | 5.54 | 1.06 | ||||||||||||
| Class R-3 – assumed 5% return | 1,000.00 | 1,019.75 | 5.37 | 1.06 | ||||||||||||
| Class R-4 – actual return | 1,000.00 | 1,088.22 | 3.98 | .76 | ||||||||||||
| Class R-4 – assumed 5% return | 1,000.00 | 1,021.26 | 3.85 | .76 | ||||||||||||
| Class R-5E – actual return | 1,000.00 | 1,089.03 | 2.93 | .56 | ||||||||||||
| Class R-5E – assumed 5% return | 1,000.00 | 1,022.26 | 2.84 | .56 | ||||||||||||
| Class R-5 – actual return | 1,000.00 | 1,089.61 | 2.41 | .46 | ||||||||||||
| Class R-5 – assumed 5% return | 1,000.00 | 1,022.76 | 2.33 | .46 | ||||||||||||
| Class R-6 – actual return | 1,000.00 | 1,090.01 | 2.15 | .41 | ||||||||||||
| Class R-6 – assumed 5% return | 1,000.00 | 1,023.01 | 2.08 | .41 | ||||||||||||
| * | The “expenses paid during period” are equal to the “annualized expense ratio,” multiplied by the average account value over the period, multiplied by the number of days in the period, and divided by 365 (to reflect the one-half year period). |
| Tax information |
unaudited |
We are required to advise you of the federal tax status of certain
distributions received by shareholders during the fiscal year. The fund hereby designates the following amounts for the fund’s
fiscal year ended November 30, 2023:
| Qualified dividend income | 100% |
| Corporate dividends received deduction | 100% |
| U.S. government income that may be exempt from state taxation | $16,273,000 |
Individual shareholders should refer to their Form 1099 or
other tax information, which will be mailed in January 2024, to determine the calendar year amounts to be included on their
2023 tax returns. Shareholders should consult their tax advisors.
Approval of Investment Advisory and Service Agreement
The fund’s board has approved the continuation of the fund’s
Investment Advisory and Service Agreement (the “agreement”) with Capital Research and Management Company (“CRMC”)
through January 31, 2024. The board approved the agreement following the recommendation of the fund’s Contracts Committee
(the “committee”), which is composed of all the fund’s independent board members. The board and the committee
determined in the exercise of their business judgment that the fund’s advisory fee structure was fair and reasonable in relation
to the services provided, and that approving the agreement was in the best interests of the fund and its shareholders.
In reaching this decision, the board and the committee took into
account their interactions with CRMC and information furnished to them throughout the year and otherwise provided to them, as well
as information prepared specifically in connection with their review of the agreement, and they were advised by their independent
counsel with respect to the matters considered. They considered the following factors, among others, but did not identify any single
issue or particular piece of information that, in isolation, was the controlling factor, and each board and committee member did
not necessarily attribute the same weight to each factor.
1. Nature, extent and quality of services
The board and the committee considered the depth and quality
of CRMC’s investment management process, including its global research capabilities; the experience, capability and integrity
of its senior management and other personnel; the low turnover rates of its key personnel; the overall financial strength and stability
of CRMC and the Capital Group organization; the resources and systems CRMC devotes to investment management (the manner in which
the fund’s assets are managed, including liquidity management), financial, investment operations, compliance, trading, proxy
voting, shareholder communications, and other services; and the ongoing evolution of CRMC’s organizational structure designed
to maintain and strengthen these qualities. The board and the committee also considered the nature, extent and quality of administrative
and shareholder services provided by CRMC to the fund under the agreement and other agreements, as well as the benefits to fund
shareholders from investing in a fund that is part of a large family of funds. The board and the committee considered the risks
assumed by CRMC in providing services to the fund, including operational, business, financial, reputational, regulatory and litigation
risks. The board and the committee concluded that the nature, extent and quality of the services provided by CRMC have benefited
and should continue to benefit the fund and its shareholders.
2. Investment results
The board and the committee considered the investment results
of the fund in light of its objective. They compared the fund’s investment results with those of other funds (including funds
that currently form the basis of the Lipper index for the category in which the fund is included), and data such as relevant market
and fund indexes over various periods (including the fund’s lifetime) through May 31, 2023. They generally placed greater
emphasis on investment results over longer term periods. On the basis of this evaluation and the boards and the committee’s
ongoing review of investment results, and considering the relative market conditions during certain reporting periods, the board
and the committee concluded that the fund’s investment results have been satisfactory for renewal of the agreement, and that
CRMC’s record in managing the fund indicated that its continued management should benefit the fund and its shareholders.
3. Advisory fees and total expenses
The board and the committee compared the advisory fees and total
expense levels of the fund to those of other relevant funds. They observed that the fund’s advisory fees and expenses generally
compared favorably to those of other similar funds included in the comparable Lipper category. The board and the committee also
considered the breakpoint discounts in the fund’s advisory fee structure that reduce the level of fees charged by CRMC to
the fund as fund assets increase. In addition, they reviewed information regarding the effective advisory fees charged to non-mutual
fund clients by CRMC and its affiliates. They noted that, to the extent there were differences between the advisory fees paid by
the fund and the advisory fees paid by those clients, the differences appropriately reflected the investment, operational, regulatory
and market differences between advising the fund and the other clients. The board and the committee concluded that the fund’s
cost structure was fair and reasonable in relation to the services provided, as well as in relation to the risks assumed by the
adviser in sponsoring and managing the fund, and that the fund’s shareholders receive reasonable value in return for the
advisory fees and other amounts paid to CRMC by the fund.
4. Ancillary benefits
The board and the committee considered a variety of other benefits
that CRMC and its affiliates receive as a result of CRMC’s relationship with the fund and other American Funds, including
fees for administrative services provided to certain share classes; fees paid to CRMC’s affiliated transfer agent; sales
charges and distribution fees received and retained by the fund’s principal underwriter, an affiliate of CRMC; and possible
ancillary benefits to CRMC and its institutional management affiliates in managing other investment vehicles. The board and the
committee reviewed CRMC’s portfolio trading practices, noting that CRMC bears the cost of third-party research. The board
and committee also noted that CRMC benefited from the use of commissions from portfolio transactions made on behalf of the fund
to facilitate payment to certain broker-dealers for research to comply with regulatory requirements applicable to these firms,
with all such amounts reimbursed by CRMC. The board and the committee took these ancillary benefits into account in evaluating
the reasonableness of the advisory fees and other amounts paid to CRMC by the fund.
5. Adviser financial information
The board and the committee reviewed information regarding CRMC’s
costs of providing services to the American Funds, including personnel, systems and resources of investment, compliance, trading,
accounting and other administrative operations. They considered CRMC’s costs and related cost allocation methodology, as
well as its track record of investing in technology, infrastructure and staff to maintain and expand services and capabilities,
respond to industry and regulatory developments, and attract and retain qualified personnel. They noted information regarding the
compensation structure for CRMC’s investment professionals. They reviewed information on the profitability of the investment
adviser and its affiliates. The board and the committee also compared CRMC’s profitability and compensation data to the reported
results and data of a number of large, publicly held investment management companies. The board and the committee noted the competitiveness
and cyclicality of both the mutual fund industry and the capital markets, and the importance in that environment of CRMC’s
long-term profitability for maintaining its independence, company culture and management continuity. They further considered the
breakpoint discounts in the fund’s advisory fee structure and CRMC’s sharing of potential economies of scale, or efficiencies,
through breakpoints and other fee reductions and costs voluntarily absorbed. The board and the committee concluded that the fund’s
advisory fee structure reflected a reasonable sharing of benefits between CRMC and the fund’s shareholders.
Board of trustees and other officers
Independent trustees1
| Name and year of birth | Year first elected a trustee of the fund2 |
Principal occupation(s) during past five years | Number of portfolios in fund complex overseen by trustee3 |
Other directorships4 held by trustee |
||||
| John G. Freund, MD, 1953 | 2000–2009 2016 |
Founder and former Managing Director, Skyline Ventures (a venture capital investor in health care companies); Co-Founder of Intuitive Surgical, Inc. (1995–2000); Co-Founder and former CEO of Arixa Pharmaceuticals, Inc. (2016–2020) |
14 | Collegium Pharmaceutical, Inc.; SI – Bone, Inc.; Sutro Biopharma, Inc. |
||||
| Pedro J. Greer Jr., 1956 | 2016 | Physician; Professor and Founding Dean, College of Medicine, Roseman University of Health Sciences; former Chairman/Associate Dean, Florida International University | 5 | None | ||||
| Merit E. Janow, 1958 | 2010 | Dean Emerita and Professor of Practice, International Economic Law & International Affairs, Columbia University, School of International and Public Affairs |
99 | Aptiv (autonomous and green vehicle technology); Mastercard Incorporated | ||||
| Earl Lewis Jr., 1955 | 2017 | Professor and Director, University of Michigan; former President, The Andrew W. Mellon Foundation | 5 | 2U, Inc. (educational technology company) | ||||
| Christopher E. Stone, 1956 Chair of the Board (Independent and Non-Executive) |
2007 | Professor of Practice of Public Integrity, University of Oxford, Blavatnik School of Government | 11 | None | ||||
| Kathy J. Williams, 1955 | 2021 | Board Chair, Above and Beyond Teaching | 11 | None | ||||
| Amy Zegart, PhD, 1967 | 2021 | Senior Fellow, Hoover Institution, Stanford University; Senior Fellow, Freeman Spogli Institute, Stanford University | 8 | Kratos Defense & Security Solutions |
Interested trustees5,6
| Name, year of birth and position with fund |
Year first elected a trustee or officer of the fund2 |
Principal occupation(s) during past five years and positions held with affiliated entities or the principal underwriter of the fund |
Number of portfolios in fund complex overseen by trustee3 |
Other directorships4 held by trustee |
||||
| Winnie Kwan, 1972 Trustee |
2019 | Partner — Capital Research Global Investors, Capital International, Inc.7 |
5 | None | ||||
| Sung Lee, 1966 Trustee |
2019 | Partner — Capital Research Global Investors, Capital Group Investment Management Pte. Ltd.7; Director, The Capital Group Companies, Inc.7 |
5 | None |
The fund’s statement of additional information includes
further details about fund directors and is available without charge upon request by calling American Funds Service Company at
(800) 421-4225 or by visiting the Capital Group website at capitalgroup.com. The address for all trustees and officers of the fund
is 333 South Hope Street, Los Angeles, CA 90071, Attention: Secretary.
Refer to page 38 for footnotes.
Other officers6
| Name, year of birth and position with fund |
Year first elected an officer of the fund2 |
Principal occupation(s) during past five years and positions held with affiliated entities or the principal underwriter of the fund |
||
| Mathews Cherian, 1967 Co-President |
2019 | Partner — Capital World Investors, Capital Research and Management Company; Partner — Capital World Investors, Capital Bank and Trust Company7 |
||
| Harold H. La, 1970 Co-President |
2006 | Partner — Capital Research Global Investors, Capital International, Inc.7 |
||
| Donald H. Rolfe, 1972 Principal Executive Officer |
2010 | Senior Vice President and Senior Counsel — Fund Business Management Group, Capital Research and Management Company; Secretary, Capital Research and Management Company |
||
| Michael W. Stockton, 1967 Executive Vice President |
2013 | Senior Vice President — Fund Business Management Group, Capital Research and Management Company |
||
| Paul Benjamin, 1979 Senior Vice President |
2023 | Partner — Capital World Investors, Capital Research and Management Company |
||
| Tomoko Fortune, 1974 Senior Vice President |
2020 | Partner — Capital World Investors, Capital Research and Management Company |
||
| Caroline Jones, 1974 Senior Vice President |
2019 | Partner — Capital Research Global Investors, Capital Research and Management Company |
||
| Reed Lowenstein, 1967 Senior Vice President |
2020 | Partner — Capital Research Global Investors, Capital Research and Management Company |
||
| Lara Pellini, 1975 Senior Vice President |
2022 | Partner — Capital World Investors, Capital Research Company7; Director, The Capital Group Companies, Inc.7 |
||
| Richmond Wolf, 1970 Senior Vice President |
2019 | Partner — Capital World Investors, Capital Research and Management Company |
||
| Jennifer L. Butler, 1966 Secretary |
2013 | Assistant Vice President — Fund Business Management Group, Capital Research and Management Company |
||
| Gregory F. Niland, 1971 Treasurer |
2016 | Vice President — Investment Operations, Capital Research and Management Company |
||
| Marilyn Paramo, 1982 Assistant Secretary |
2023 | Associate — Fund Business Management Group, Capital Research and Management Company |
||
| Sandra Chuon, 1972 Assistant Treasurer |
2019 | Vice President — Investment Operations, Capital Research and Management Company |
||
| W. Michael Pattie, 1981 Assistant Treasurer |
2020 | Assistant Vice President — Investment Operations, Capital Research and Management Company |
| 1 | The term independent trustee refers to a trustee who is not an “interested person” of the fund within the meaning of the Investment Company Act of 1940. |
| 2 | Trustees and officers of the fund serve until their resignation, removal or retirement. |
| 3 | Funds managed by Capital Research and Management Company or its affiliates. |
| 4 | This includes all directorships/trusteeships (other than those in the American Funds or other funds managed by Capital Research and Management Company or its affiliates) that are held by each trustee as a trustee or director of a public company or a registered investment company. |
| 5 | The term interested trustee refers to a trustee who is an “interested person” within the meaning of the Investment Company Act of 1940, on the basis of their affiliation with the fund’s investment adviser, Capital Research and Management Company, or affiliated entities (including the fund’s principal underwriter). |
| 6 | All of the trustees and/or officers listed, with the exception of Tomoko Fortune, Caroline Jones and Reed Lowenstein, are officers and/or directors/trustees of one or more of the other funds for which Capital Research and Management Company serves as investment adviser. |
| 7 | Company affiliated with Capital Research and Management Company. |
| 38 | The New Economy Fund |
This page was intentionally left blank.
This page was intentionally left blank.
This page was intentionally left blank.
This page was intentionally left blank.
This page was intentionally left blank.
Office of the fund
333 South Hope Street
Los Angeles, CA 90071-1406
Investment adviser
Capital Research and Management Company
333 South Hope Street
Los Angeles, CA 90071-1406
Transfer agent for shareholder accounts
American Funds Service Company
(Write to the address nearest you.)
P.O. Box 6007
Indianapolis, IN 46206-6007
P.O. Box 2280
Norfolk, VA 23501-2280
Custodian of assets
State Street Bank and Trust Company
One Lincoln Street
Boston, MA 02111-2900
Counsel
O’Melveny & Myers LLP
400 South Hope Street
Los Angeles, CA 90071-2899
Independent registered public accounting firm
PricewaterhouseCoopers LLP
601 South Figueroa Street
Los Angeles, CA 90017-3874
Principal underwriter
American Funds Distributors, Inc.
333 South Hope Street
Los Angeles, CA 90071-1406
Investors should carefully consider investment objectives,
risks, charges and expenses. This and other important information is contained in the fund prospectus and summary prospectus, which
can be obtained from your financial professional and should be read carefully before investing. You may also call American Funds
Service Company (AFS) at (800) 421-4225 or visit the Capital Group website at capitalgroup.com.
“American Funds Proxy Voting Procedures and Principles”
— which describes how we vote proxies relating to portfolio securities — is available on our website or upon request
by calling AFS. The fund files its proxy voting record with the U.S. Securities and Exchange Commission (SEC) for the 12 months
ended June 30 by August 31. The proxy voting record is available free of charge on the SEC website at sec.gov and on our website.
The New Economy Fund files a complete list of its portfolio holdings
with the SEC for the first and third quarters of each fiscal year on Form NPORT-P. The list of portfolio holdings is available
free of charge on the SEC website and on our website.
This report is for the information of shareholders of The New
Economy Fund, but it also may be used as sales literature when preceded or accompanied by the current prospectus or summary prospectus,
which gives details about charges, expenses, investment objectives and operating policies of the fund. If used as sales material
after March 31, 2024, this report must be accompanied by an American Funds statistical update for the most recently completed calendar
quarter.
FTSE/Russell indexes: London Stock Exchange Group plc and its
group undertakings (collectively, the “LSE Group”). © LSE Group 2024 FTSE Russell is a trading name of certain
of the LSE Group companies. FTSE indexes are trademarks of the relevant LSE Group companies and are used by any other LSE Group
company under license. All rights in the FTSE Russell indexes or data vest in the relevant LSE Group company which owns the index
or the data. Neither LSE Group nor its licensors accept any liability for any errors or omissions in the indexes or data and no
party may rely on any indexes or data contained in this communication. No further distribution of data from the LSE Group is permitted
without the relevant LSE Group company’s express written consent. The LSE Group does not promote, sponsor or endorse the
content of this communication.
MSCI has not approved, reviewed or produced this report, makes
no express or implied warranties or representations and is not liable whatsoever for any data in the report. You may not redistribute
the MSCI data or use it as a basis for other indices or investment products.
The S&P 500 Index (“Index”) is a product of S&P
Dow Jones Indices LLC and/or its affiliates and has been licensed for use by Capital Group. Copyright © 2024 S&P Dow Jones
Indices LLC, a division of S&P Global, and/or its affiliates. All rights reserved. Redistribution or reproduction in whole
or in part is prohibited without written permission of S&P Dow Jones Indices LLC.
American Funds Distributors, Inc.
The Capital Advantage®
Since 1931, Capital Group, home of American Funds, has helped
investors pursue long-term investment success. Our consistent approach — in combination with The Capital SystemTM —
has resulted in superior outcomes.
Aligned with investor success
We base our decisions on a long-term perspective, which we believe
aligns our goals with the interests of our clients. Our portfolio managers average 28 years of investment industry experience,
including 22 years at our company, reflecting a career commitment to our long-term approach.1
The Capital System
The Capital System combines individual accountability with teamwork.
Funds using The Capital System are divided into portions that are managed independently by investment professionals with diverse
backgrounds, ages and investment approaches. An extensive global research effort is the backbone of our system.
American Funds’ superior outcomes
Equity-focused funds have beaten their Lipper peer indexes in
90% of 10-year periods and 99% of 20-year periods.2 Relative to their peers, our fixed income funds have helped investors
achieve better diversification through attention to correlation between bonds and equities.3 Fund management fees have
been among the lowest in the industry.4
| 1 | Investment industry experience as of December 31, 2022. | |
| 2 | Based on Class F-2 share results for rolling monthly 10- and 20-year periods starting with the first 10- or 20-year period after each mutual fund’s inception through December 31, 2022. Periods covered are the shorter of the fund’s lifetime or since the comparable Lipper index inception date (except Capital Income Builder and SMALLCAP World Fund, for which the Lipper average was used). Expenses differ for each share class, so results will vary. Past results are not predictive of results in future periods. | |
| 3 | Based on Class F-2 share results as of December 31, 2022. Sixteen of the 18 fixed income American Funds that have been in existence for the three-year period showed a three-year correlation lower than their respective Morningstar peer group averages. S&P 500 Index was used as an equity market proxy. Correlation based on monthly total returns. Correlation is a statistical measure of how two securities move in relation to each other. A correlation ranges from –1 to 1. A positive correlation close to 1 implies that as one security moves, either up or down, the other security will move in “lockstep,” in the same direction. A negative correlation close to –1 indicates that the securities have moved in the opposite direction. | |
| 4 | On average, our mutual fund management fees were in the lowest quintile 62% of the time, based on the 20-year period ended December 31, 2022, versus comparable Lipper categories, excluding funds of funds. |
Class F-2 shares were first offered on August 1, 2008. Class
F-2 share results prior to the date of first sale are hypothetical based on the results of the original share class of the fund
without a sales charge, adjusted for typical estimated expenses. Results for certain funds with an inception date after August
1, 2008, also include hypothetical returns because those funds’ Class F-2 shares sold after the funds’ date of first
offering. Refer to capitalgroup.com for more information on specific expense adjustments and the actual dates of first sale.
All Capital Group trademarks mentioned are owned by The Capital
Group Companies, Inc., an affiliated company or fund. All other company and product names mentioned are the property of their respective
companies.

ITEM 2 – Code of Ethics
The Registrant has adopted a Code of Ethics that applies
to its Principal Executive Officer and Principal Financial Officer. The Registrant undertakes to provide to any person without charge,
upon request, a copy of the Code of Ethics. Such request can be made by calling 800/421-4225 or to the Secretary of the Registrant, 333
South Hope Street, 55th Floor, Los Angeles, California 90071.
ITEM 3 – Audit Committee Financial Expert
The Registrant’s board has determined that John
G. Freund, a member of the Registrant’s audit committee, is an “audit committee financial expert” and “independent,”
as such terms are defined in this Item. This designation will not increase the designee’s duties, obligations or liability as compared
to his or her duties, obligations and liability as a member of the audit committee and of the board, nor will it reduce the responsibility
of the other audit committee members. There may be other individuals who, through education or experience, would qualify as “audit
committee financial experts” if the board had designated them as such. Most importantly, the board believes each member of the audit
committee contributes significantly to the effective oversight of the Registrant’s financial statements and condition.
ITEM 4 – Principal Accountant Fees and Services
| NEF | ||
| Registrant: | ||
| a) Audit Fees: | ||
| Audit | 2022 | 123,000 |
| 2023 | 130,000 | |
| b) Audit-Related Fees: | ||
| 2022 | None | |
| 2023 | None | |
| c) Tax Fees: | ||
| 2022 | 9,000 | |
| 2023 | 10,000 | |
| The tax fees consist of professional services relating to the preparation of the Registrant’s tax returns. | ||
| d) All Other Fees: | ||
| 2022 | None | |
| 2023 | None | |
| Adviser and affiliates (includes only fees for non-audit services billed to the adviser and affiliates for engagements that relate directly to the operations and financial reporting of the Registrant and were subject to the pre-approval policies described below): | ||
| a) Audit Fees: | ||
| Not Applicable | ||
| b) Audit-Related Fees: | ||
| 2022 | None | |
| 2023 | None | |
| The audit-related fees consist of assurance and related services relating to the examination of the Registrant’s transfer agent, principal underwriter and investment adviser conducted in accordance with Statement on Standards for Attestation Engagements Number 18 issued by the American Institute of Certified Public Accountants. | ||
| c) Tax Fees: | ||
| 2022 | None | |
| 2023 | None |
| The tax fees consist of consulting services relating to the Registrant’s investments. | ||
| d) All Other Fees: | ||
| 2022 | None | |
| 2023 | None | |
| The other fees consist of subscription services related to an accounting research tool. | ||
| All audit and permissible non-audit services that the Registrant’s audit committee considers compatible with maintaining the independent registered public accounting firm’s independence are required to be pre-approved by the committee. The pre-approval requirement will extend to all non-audit services provided to the Registrant, the investment adviser, and any entity controlling, controlled by, or under common control with the investment adviser that provides ongoing services to the Registrant, if the engagement relates directly to the operations and financial reporting of the Registrant. The committee will not delegate its responsibility to pre-approve these services to the investment adviser. The committee may delegate to one or more committee members the authority to review and pre-approve audit and permissible non-audit services. Actions taken under any such delegation will be reported to the full committee at its next meeting. The pre-approval requirement is waived with respect to non-audit services if certain conditions are met. The pre-approval requirement was not waived for any of the non-audit services listed above provided to the Registrant, adviser and affiliates. | ||
| Aggregate non-audit fees paid to the Registrant’s auditors, including fees for all services billed to the Registrant, adviser and affiliates that provide ongoing services to the Registrant, were $9,000 for fiscal year 2022 and $10,000 for fiscal year 2023. The non-audit services represented by these amounts were brought to the attention of the committee and considered to be compatible with maintaining the auditors’ independence. |
ITEM 5 – Audit Committee of Listed Registrants
Not applicable to this Registrant, insofar as the Registrant
is not a listed issuer as defined in Rule 10A-3 under the Securities Exchange Act of 1934.
ITEM 6 – Schedule of Investments
Not applicable, insofar as the schedule is included
as part of the report to shareholders filed under Item 1 of this Form.
ITEM 7 – Disclosure of Proxy Voting Policies
and Procedures for Closed-End Management Investment Companies
Not applicable to this Registrant, insofar as the Registrant
is not a closed-end management investment company.
ITEM 8 – Portfolio Managers of Closed-End Management
Investment Companies
Not applicable to this Registrant, insofar as the Registrant
is not a closed-end management investment company.
ITEM 9 – Purchases of Equity Securities by Closed-End
Management Investment Company and Affiliated Purchasers
Not applicable to this Registrant, insofar as the Registrant
is not a closed-end management investment company.
ITEM 10 – Submission of Matters to a Vote of
Security Holders
There have been no material changes to the procedures
by which shareholders may recommend nominees to the Registrant’s board of trustees since the Registrant last submitted a proxy statement
to its shareholders. The procedures are as follows. The Registrant has a nominating and governance committee comprised solely of persons
who are not considered ‘‘interested persons’’ of the Registrant within the meaning of the Investment Company Act
of 1940, as amended. The committee periodically reviews such issues as the board’s composition, responsibilities, committees, compensation
and other relevant issues, and recommends any appropriate changes to the full board of trustees. While the committee normally is able
to identify from its own resources an ample number of qualified candidates, it will consider shareholder suggestions of persons to be
considered as nominees to fill future vacancies on the board. Such suggestions must be sent in writing to the nominating and governance
committee of the Registrant, c/o the Registrant’s Secretary, and must be accompanied by complete biographical and occupational data
on the prospective nominee, along with a written consent of the prospective nominee for consideration of his or her name by the nominating
and governance committee.
ITEM 11 – Controls and Procedures
| (a) | The Registrant’s Principal Executive Officer and Principal Financial Officer have concluded, based on their evaluation of the Registrant’s disclosure controls and procedures (as such term is defined in Rule 30a-3 under the Investment Company Act of 1940), that such controls and procedures are adequate and reasonably designed to achieve the purposes described in paragraph (c) of such rule. |
| (b) |
There were no changes in the Registrant’s internal
|
ITEM 12 – Exhibits
| (a)(1) | The Code of Ethics that is the subject of the disclosure required by Item 2 is attached as an exhibit hereto. |
| (a)(2) | The certifications required by Rule 30a-2 of the Investment Company Act of 1940 and Sections 302 and 906 of the Sarbanes-Oxley Act of 2002 are attached as exhibits hereto. |
SIGNATURES
Pursuant to the requirements of the Securities Exchange
Act of 1934 and the Investment Company Act of 1940, the Registrant has duly caused this report to be signed on its behalf by the undersigned,
thereunto duly authorized.
| THE NEW ECONOMY FUND | |
| By __/s/ Donald H. Rolfe________________ | |
|
Donald H. Rolfe, Principal Executive Officer |
|
| Date: January 31, 2024 |
Pursuant to the requirements of the Securities Exchange
Act of 1934 and the Investment Company Act of 1940, this report has been signed below by the following persons on behalf of the Registrant
and in the capacities and on the dates indicated.
| By _ /s/ Donald H. Rolfe_____________ |
|
Donald H. Rolfe, Principal Executive Officer |
| Date: January 31, 2024 |
| By ___/s/ Gregory F. Niland_______________ |
|
Gregory F. Niland, Treasurer and Principal Financial Officer |
| Date: January 31, 2024 |
ATTACHMENTS / EXHIBITS
COE
CERT302
CERT906
[ad_2]
Source link